Search results
Create the page "Maps of contamination" on this wiki! See also the search results found.
File:47ae1 F59A51E334FB791F36AB413B5BC15C0C.jpg leading to the map of nuclear contamination of Japan in 2011 from ...eyword.info/japan-drawn-with-the-united-states-announced-nuclear-radiation-contamination-map-figure/(230 × 300 (25 KB)) - 09:38, 21 June 2013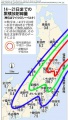
File:4t1.jpg Map of contamination that is usually attributed to the [[Fukushima disaster]], average for 2011 Contour of land/sea/cities and the primary data are by Devchonka from http://mainichi(789 × 1,391 (86 KB)) - 09:38, 21 June 2013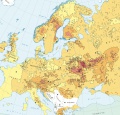
File:ChernobylEuropeCut2a.jpg Cut from the map of contamination of Europe with Cs-137 for y.2008 from the Source of the map. (2008)(1,074 × 1,030 (483 KB)) - 09:38, 21 June 2013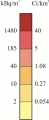
File:ChernobylEuropeNota0a1.jpg Notations for the map of contamination of Europe with Cs-137 for year 2008 by [[Category:maps]](294 × 717 (30 KB)) - 09:38, 21 June 2013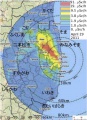
File:Fukushima-ground-ra7.jpg Map of contamination after the [[Fukushima disaster]]. This pic is update of [[File:Fukushima-ground-radiation.jpg|80px]] which seems to be almost unusa(594 × 822 (43 KB)) - 09:38, 21 June 2013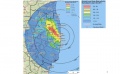
File:Fukushima-ground-radiation.jpg http://maptd.com/new-fukushima-contamination-map/ New Fukushima contamination map. Posted on May 10, 2011 by James(640 × 396 (45 KB)) - 09:38, 21 June 2013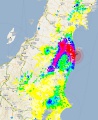
File:Fukushima2011july18a.jpg Map of contamination attributed to the [[Fukushima disaster]], image from If the authorities cannot draw the unambiguous map of contamination, there is no reason to expect that they can handle a nuclear power plant in(735 × 900 (232 KB)) - 09:39, 21 June 2013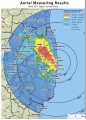
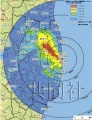
File:Fukushima 180511.jpg ...of radiocaesium (sum of Cs-134 and Cs-137) for the land area within 80 km of the Fukushima Daiichi plant, as reported by the Japanese authorities (MEXT) The scale levels of contamination becomes readable the strong zooming-in of the upper right corner. The following notations are used:(650 × 904 (255 KB)) - 09:38, 21 June 2013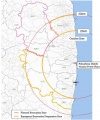
File:FukushimaReport2011may2fig2.jpg Members of the Great East Japan Earthquake Taskforce: Report to the Foreign Academies from Science Council of Japan on the Fukushima Daiichi Nuclear Power Plant Accident.(864 × 1,038 (53 KB)) - 09:38, 21 June 2013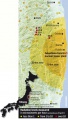
File:Image-202028-galleryV9-ehmb.jpg Map of radioactive contamination for 2011 April 7 by Der Spiegel, Numbers indicate the levels of radiation in microsievert/hour(343 × 600 (88 KB)) - 09:38, 21 June 2013
File:Mayak1957Vurs.gif Quakutative trace of contamination after the explosion at the nuclear industry Mayak 1957 September 29 by ...of barbarian use of the land leaded to the contamination of the huge areas of the USSR,(850 × 454 (28 KB)) - 09:39, 21 June 2013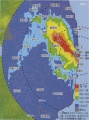
File:Newton2011 7 27b.jpg Map of contamination after the [[Fukushima disaster]]. Colors represent the density $D(\alpha,\delta)$ of ionizing radiation measured from the aircrafts (airplanes helicopters) and(1,025 × 1,377 (81 KB)) - 09:38, 21 June 2013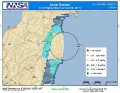
File:NISAdoe1.jpg Map of contamination after the [[Fukushima disaster]] Some other data indicate the level of radiation in $\mu$Sv/hour(769 × 595 (108 KB)) - 09:38, 21 June 2013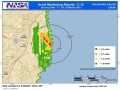
File:NISAdoe3.jpg Map of contamination after the [[Fukushima disaster]] [[Category:Maps]](769 × 577 (95 KB)) - 09:38, 21 June 2013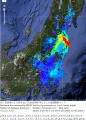
File:Nnistar01.jpg Map of contamination of Japan after the Fukushima disaster by Snapshot of the interactive map for July 7, 2011.(1,461 × 2,045 (952 KB)) - 09:39, 21 June 2013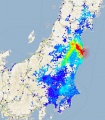
File:Nnistar04a.jpg Map of contamination of Japan after the Fukushima disaster by Snapshot of the interactive map for July 7, 2011.(1,474 × 1,683 (166 KB)) - 09:39, 21 June 2013
File:Nnistar04b.png Scale for Map of contamination of Japan, after the Fukushima disaster by Snapshot of the interactive map for July 7, 2011.(944 × 54 (12 KB)) - 09:39, 21 June 2013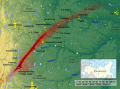
File:Ostural-Spur.png Map of the East Urals Radioactive Trace (EURT): area contaminated by the Kyshtym d ...sider, Kneiphof собственная работа, background image from maps-for-free.com, File:Russia conic location map.svg(1,070 × 790 (1.38 MB)) - 09:39, 21 June 2013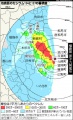
File:Radiation-map-fukushima1.jpg Map of contamination after the [[Fukushima disaster]]. ...s found: Both TEPCO and the Government representatives seem to ignore such maps. Perhaps, this map is still preliminary version.(304 × 500 (85 KB)) - 09:38, 21 June 2013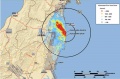
File:Si-radiation-thumb-200xauto-6005b.jpg Cumulative Aerial map of contamination after the [[Fukushima disaster]] for by data of A new map from the U.S. Department of Energy (DOE) posted by Jocelyn Kaiser(1,520 × 1,002 (71 KB)) - 09:38, 21 June 2013


