File:Duration5compar2.jpg
Original file (1,786 × 552 pixels, file size: 137 KB, MIME type: image/jpeg)
Description
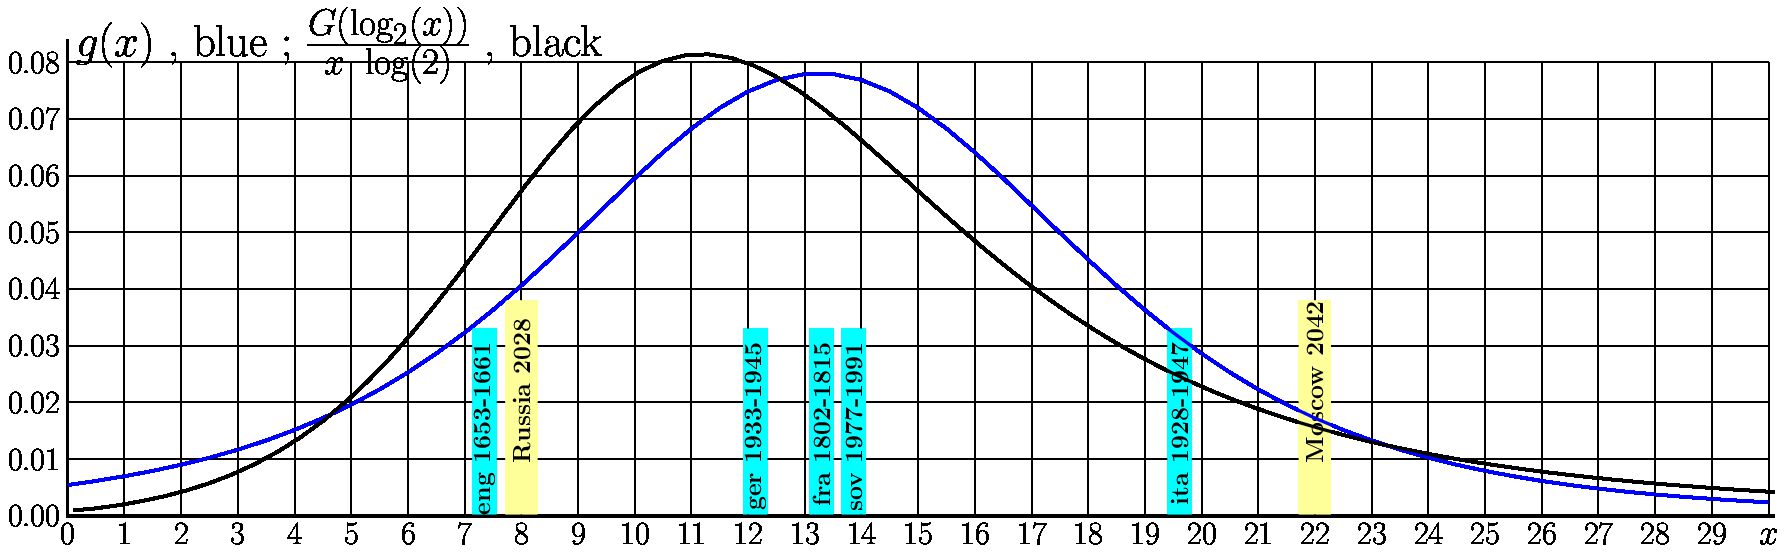
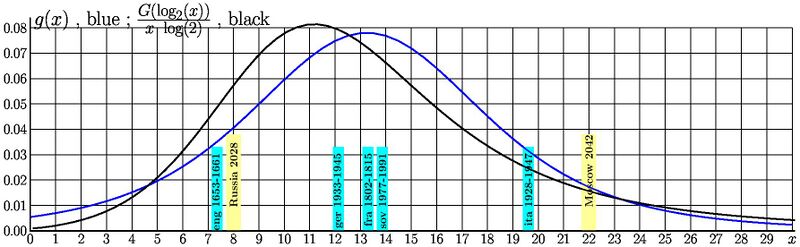
Comparison of the likelihood distribution density for Duration in 2 models:
1. Normal distribution of Duration
2. Normal distribution of binary logarithm of Duration.
The picture is prepared for article Duration5.
The code below generates also two other pictures and the table for teh same article.
Generator of picture
The main code requires several files.
Files ju24da.cin and Student.cin should be loaded for the compilation.
Files "i.txt" and "HtmlHead.txt" below should be loaded for the execution.
i.txt
1653 12 16 1661 04 23 eng
1802 08 04 1815 11 20 fra
1928 05 17 1947 12 27 ita
1933 03 24 1945 05 08 ger
1977 10 07 1991 08 20 sov
HtmlHead.txt
<!DOCTYPE html><html>
<script type="text/x-mathjax-config">
MathJax.Hub.Config({
  CommonHTML: { matchFontHeight: false },
  tex2jax: {inlineMath: [['$','$'],['\\(','\\)']], processEscapes: true }
   });
</script>
<script async src="https://cdnjs.cloudflare.com/ajax/libs/mathjax/2.7.0/MathJax.js?config=TeX-AMS_CHTML"></script>
<head>
<meta charset="utf-8"/>
</head>
<body>
main code
#include <stdio.h>
#include <math.h>
#include <stdlib.h>
#include "ju24da.cin"
#include "Student.cin"
int main(){ int n,N=5; // The 6th case is not yet comleted. Here cases are numerated beginning with 0.
FILE *i,*o; // Input and Output pointers.
int Y1,M1,D1; //Year, Month, Day
int Y2,M2,D2; char str[N][4]; //just a string for each case
int Ya[N],Yb[N]; //the same as Y1,Y2, but arrays

int Days[N]; // Notaton "D" is confusive; better not to use it
float X[N]; // data for Linear scale (in years)
float L[N]; // data for Logaritmic scale
float x,y,p,q,r; // coordinates and other dummy variales

i=fopen("i.txt","r"); // input; computation of values of arrays X and L
for(n=0;n<N;n++){
fscanf(i,"%4d %2d %2d %4d %2d %2d %3s", &Y1,&M1,&D1, &Y2,&M2,&D2, str[n]); Ya[n]=Y1; Yb[n]=Y2;
Days[n]=daju24(Y2,M2,D2) - daju24(Y1,M1,D1) ; x=Days[n]/365.2422; X[n]=x; L[n]=log2(x);
printf("%4d %02d %02d %04d %02d %02d %3s %04d %6.4f %6.4f\n", Y1,M1,D1, Y2,M2,D2, str[n], Days[n], X[n], L[n]);
                 } fclose(i);

// Notations:
float t,T; // mean valies of data for the Linear scale and the Logarithmic scale;
float s,S; // estimates for standard error;
float c,C; // parameters of Student for mean value;
float v,V; // estimates for the standard error of the mean value (width of the distribution)
float c1,C1; // parameters of the Student Distribution for next measurement
float w,W; //estimates for the widths of distribution for the next measurement

// Linear scale
p=0.; for(n=0;n<N;n++) p+=X[n];  t=p/N; printf("tildeX=t=%5.2f\n",t); // mean value
q=0.; for(n=0;n<N;n++) {r=X[n]-t; q+=r*r;}
s=sqrt(q/(N-1.));  printf("s=%5.2f\n",s); // scale for standard error
c=sqrt(q/(N*(N-1.)));  printf("c =%5.2f\n",c ); // parameter for Student for mean value
c1=s*sqrt(1.+1./N);  printf("c1=%5.2f\n",c1); // parameter for Student for next value
v=sqrt(q/(N*(N-3.))); printf("z=%5.2f\n",v);  // spread for the mean value
w=s*sqrt((N-1.)/(N-3.))*sqrt(1.+1./N);  printf("delta=%5.2f\n",w);  // spread for next value

o=fopen("Duration5Li.tex","w");
fprintf(o,"\\documentclass{standalone}\n");
fprintf(o,"\\usepackage{graphicx}\n");
fprintf(o,"\\usepackage{tikz}\n");
//fprintf(o,"\\newcommand \\sx {\\scalebox}\n"); // no need: \Huge does the job
fprintf(o,"\\begin{document}\n");
fprintf(o,"\\Huge\n");
fprintf(o,"\\begin{tikzpicture}[scale=2]\n");
fprintf(o,"\\draw [line width=0.981] (0,0) grid (24,4);\n");
fprintf(o,"\\draw [line width=2.3] (0,4.4) -- (0,0) -- (24.1,0) ;\n");
fprintf(o,"\\draw (-.08,4.3) node[right] {\\(f(x), g(x)\\)};\n");
fprintf(o,"\\definecolor{light}{rgb}{1,1,.6}\n"); // warning: no need ";" after to definecolor!!
fprintf(o,"\\definecolor{dark}{rgb}{0,1,1}\n");
fprintf(o,"\\draw[line width=32, light] (8,0.03) -- (8,3.8) ;\n");
fprintf(o,"\\draw (8,0.8) node[rotate=90,right] {\\bf Russia 2028};\n");
fprintf(o,"\\draw[line width=32, light] (22,0.03) -- (22,3.8) ;\n");
fprintf(o,"\\draw(22,0.8) node[rotate=90,right] {\\bf Moscow 2042};\n");

for(n=0;n<N;n++){
fprintf(o,"\\draw[line width=24, dark] (%5.3f,0.03) -- (%5.3f,3.3) ;\n",X[n], X[n]);
fprintf(o,"\\draw (%5.3f,3.2) node[rotate=90,left] {\\bf %s %4d-%4d};\n",X[n],str[n],Ya[n],Yb[n]);
printf("%1d %s\n",n,str[n]);
                }

for(n=0;n<5;n+=2) fprintf(o,"\\draw (0,%d) node[left] {%3.1f};\n",n,0.05*n);
for(n=0;n<24;n++) fprintf(o,"\\draw (%d,0) node[below] {%d};\n",n,n);
                 fprintf(o,"\\draw (%d,0) node[below] {\\(x\\)};\n",n);

printf("t=%9.6f ; c =%9.6f\n",t,c);
fprintf(o,"\\draw[line width=5, red] (0,0)");
for(n=1;n<241;n+=2)
{ x=.1*n; y=20*Student(N-1,(x-t)/c)/c;        fprintf(o," -- (%6.3f,%6.3f)",x,y);
printf("curve 1: %6.4f %6.4f\n",x,y);
}
fprintf(o,";\n");

printf("t=%9.6f ; c1=%9.6f\n",t,c1);
for(n=0;n<241;n+=5)
{       x=.1*n; y=20*Student(N-1,(x-t)/c1)/c1;
        if(n==0) fprintf(o,"\\draw[line width=3, blue] (0,%6.3f)",y);
        else     fprintf(o," -- (%6.3f,%6.3f)",x,y);
printf("curve 2: %6.4f %6.4f\n",x,y);
}
fprintf(o,";\n");
x=14.54; y=20*Student(N-1,(x-t)/c)/c;
fprintf(o,"\\draw (%5.2f,%5.2f) node[above] {\\(f(x)\\)};\n",x,y+.2);
//fprintf(o,";\n");

x=14.6; y=20*Student(N-1,(x-t)/c1)/c1;
fprintf(o,"\\draw (%5.2f,%5.2f) node[above] {\\(g(x)\\)};\n",x,y-.1);
//fprintf(o,";\n");

fprintf(o,"\\end{tikzpicture}\n");
fprintf(o,"\\end{document}\n");
fclose(o);

system("pdflatex Duration5Li.tex");
//system("open Duration5Li.pdf &");

// getchar();
// printf("The continuation is not yet ready\n");

// Logarithmic scale
p=0.; for(n=0;n<N;n++) p+=L[n];  T=p/N; printf("tildeL=T=%5.2f\n",t); // mean value
q=0.; for(n=0;n<N;n++) {r=L[n]-T; q+=r*r;}
S=sqrt(q/(N-1.));  printf("S=%5.2f\n",S); // scale for standard error
C=sqrt(q/(N*(N-1.)));  printf("C =%5.2f\n",C ); // parameter for Student for mean value
C1=S*sqrt(1.+1./N);  printf("C1=%5.2f\n",C1); // parameter for Student for next value
V=sqrt(q/(N*(N-3.))); printf("sigma=%5.2f\n",V);  // spread for the mean value
W=S*sqrt((N-1.)/(N-3.))*sqrt(1.+1./N);  printf("Delta=%5.2f\n",W); // spread for next value

o=fopen("Duration5Lo.tex","w");
fprintf(o,"\\documentclass{standalone}\n");
fprintf(o,"\\usepackage{graphicx}\n");
fprintf(o,"\\usepackage{tikz}\n");
//fprintf(o,"\\newcommand \\sx {\\scalebox}\n");
fprintf(o,"\\begin{document}\n");
fprintf(o,"\\Large\n");
//fprintf(o,"\\begin{tikzpicture}[scale=2]\n");
fprintf(o,"\\begin{tikzpicture}[scale=5]\n");
fprintf(o,"\\draw [line width=0.981] (0,0) grid (6,2);\n");
fprintf(o,"\\draw [line width=2.3] (0,2.2) -- (0,0) -- (6.1,0) ;\n");

fprintf(o,"\\definecolor{light}{rgb}{1,1,.6}\n");
fprintf(o,"\\definecolor{dark}{rgb}{0,1,1}\n");
fprintf(o,"\\draw[line width=12, light] (3,0.03) -- (3,1.4) ;\n");
fprintf(o,"\\draw (3,0.6) node[rotate=90,right] {\\bf Russia 2028};\n");
fprintf(o,"\\draw[line width=12, light] (%4.2f,0.03) -- (%4.2f,1.4) ;\n",log2(22.),log2(22.));
fprintf(o,"\\draw(%4.2f,0.6) node[rotate=90,right] {\\bf Moscow 2042};\n", log2(22.));

for(n=0;n<N;n++)
{
fprintf(o,"\\draw[line width=7, dark] (%5.3f,0.04) -- (%5.3f,0.4) ;\n",L[n], L[n]);
fprintf(o,"\\draw (%5.3f,0.3) node[rotate=90,left] {\\bf %s};\n",L[n],str[n]);
printf("%1d %s\n",n,str[n]);
}

fprintf(o,"\\Huge\n");
fprintf(o,"\\draw (.04,2.1) node[right] {\\(F(L), G(L)\\)};\n");
for(n=0;n<3;n+=1) fprintf(o,"\\draw (0,%d) node[left] {%d};\n",n,n);
for(n=0;n<6;n++) fprintf(o,"\\draw (%d,0) node[below] {%d};\n",n,n);
                 fprintf(o,"\\draw (%d,0) node[below] {\\(L\\)};\n",n);

int m=1;
for(n=0;n<6;n++) {fprintf(o,"\\draw (%d,-0.2) node[below] {%d};\n",n,m); m*=2;}
                 fprintf(o,"\\draw (%d,-0.2) node[below] {\\(t\\), y.};\n",n);

printf("Lod scale, curve 1. T=%9.6f ; C=%9.6f\n",T,C);
fprintf(o,"\\draw[line width=5, red] (0,0)");
for(n=1;n<601;n+=2){x=.01*n; y=Student(N-1,(x-T)/C)/C;	fprintf(o," -- (%6.4f,%6.4f)",x,y);}
fprintf(o,";\n");

printf("Lod scale, curve 2. T=%9.6f ; C1=%9.6f\n",T,C1);
for(n=0;n<601;n+=4)
{	x=.01*n; y=Student(N-1,(x-T)/C1)/C1;
	if(n==0) fprintf(o,"\\draw[line width=3, blue] (0,%6.3f)",y);
	else     fprintf(o," -- (%6.3f,%6.3f)",x,y);
}
fprintf(o,";\n");

x=T; y=Student(N-1,(x-T)/C)/C;
fprintf(o,"\\draw (%5.2f,%5.2f) node[above] {\\(F(L)\\)};\n",x,y-.06);
//fprintf(o,";\n");

x=T; y=Student(N-1,(x-T)/C1)/C1;
fprintf(o,"\\draw (%5.2f,%5.2f) node[above] {\\(G(L)\\)};\n",x,y-.06);
//fprintf(o,";\n");

fprintf(o,"\\end{tikzpicture}\n");
fprintf(o,"\\end{document}\n");

fclose(o);
system("pdflatex Duration5Lo.tex");
//system("open Duration5Lo.pdf");

system("cp HtmlHead.txt Duration5tableBig.htm");
o=fopen("Duration5tableBig.htm","a");
fprintf(o,"<table border=1 cellpadding=6 cellspacing=3 style=\"border-collapse:collapse; text-align:center; border:1px solid\">\n");
// Do I need "solid:" above?
fprintf(o,"<tr><th>Quantity</th>\n");
//fprintf(o,"<th>Model First<br><small>(Normal distribution of durations)</small></th>\n");
//fprintf(o,"<th>Model Second<br><small>(Normal distribution of binary logarithms)</small></th></tr>\n");
fprintf(o,"<th><small>Normal distribution of durations)</small></th>\n");
fprintf(o,"<th><small>Normal distribution of the binary logarithms</small></th></tr>\n");

fprintf(o,"<tr><td>Distribution</td>\n");
fprintf(o,"<td>\\( X \\sim \\mathcal{N}(X_0, \\sigma_0^2) \\)</td>\n");
fprintf(o,"<td>\\( L = \\log_2 X \\sim \\mathcal{N}(L_0, \\ell_0^2) \\)</td></tr>\n");

fprintf(o,"<tr><td>mean; \\(N\\!=\\!\%d\\)</td>\n",N);
fprintf(o,"<td>\\(t=\\frac{1}{N} \\sum_{n=1}^N X_n\\approx%9.6f\\) [y.]</td>\n",t);
fprintf(o,"<td>\\(T=\\frac{1}{N} \\sum_{n=1}^N L_n\\approx%9.6f\\) <br>\n",T);
fprintf(o,"\\(\\exp_2(T)\\approx%9.6f\\) [y.]</td></tr>\n",pow(2.,T));

fprintf(o,"<tr><td>samle spread</td>\n");
fprintf(o,"<td>\\(s=\\sqrt{\\frac{1}{N-1} \\sum_{n=1}^N (X_n-t)^2}\\approx%9.6f\\) [y.]</td>\n",s);
fprintf(o,"<td>\\(S=\\sqrt{\\frac{1}{N-1} \\sum_{n=1}^N (L_n-T)^2}\\approx%9.6f\\)\n",S);
fprintf(o,"</td></tr>\n"); // only one line

fprintf(o,"<tr><td>scale for Student</td>\n");
fprintf(o,"<td>\\(c=\\sqrt{\\frac{1}{(N-1)N} \\sum_{n=1}^N (X_n\\!-\\!t)^2}\\approx%9.6f\\) [y.]</td>\n",c);
fprintf(o,"<td>\\(C=\\sqrt{\\frac{1}{(N-1)N} \\sum_{n=1}^N (L_n\\!-\\!T)^2}\\approx%9.6f\\)\n",C);
fprintf(o,"</td></tr>\n"); // only one line

fprintf(o,"<tr><td>Density for mean</td>\n");
fprintf(o,"<td>\\(f(x)=\\frac{1}{c} \\mathrm{Student}_{N-1}\\!\\left( \\frac{x-t}{c}\\right) \\ ~ \\) [y.\\(^{-1}\\)]</td>\n");
fprintf(o,"<td>\\(F(L)=\\frac{1}{C} \\mathrm{Student}_{N-1}\\!\\left( \\frac{L-T}{C}\\right)\\)");
fprintf(o,"</td></tr>\n"); // only one line


fprintf(o,"<tr><td>Spread for mean</td>\n");
fprintf(o,"<td>\\(v= \\sqrt{ \\int_{-\\infty}^{\\infty} f(x) ~ (x\\!-\\!t)^2 \\ \\mathrm d x \\ }\\)<br>\n");
fprintf(o,"    \\( = \\sqrt{\\frac{N-1}{N-3}}\\ c \\approx %9.6f\\ \\) [y.]</td>\n",v);
fprintf(o,"<td>\\(V= \\sqrt{ \\int_{-\\infty}^{\\infty} F(L) ~ (L\\!-\\!T)^2 \\ \\mathrm d L \\ }\\)<br>\n");
fprintf(o,"    \\( = \\sqrt{\\frac{N-1}{N-3}}\\ C \\approx %9.6f\\)</td>\n",V);
fprintf(o,"</tr>\n");

fprintf(o,"<tr><td>scale for Next</td>\n");
fprintf(o,"<td>\\(c_1 = s \\sqrt{1+1/N}\\approx%9.6f\\) [y.]</td>\n",c1);
fprintf(o,"<td>\\(C_1 = S \\sqrt{1+1/N}\\approx%9.6f\\)\n",C1);
fprintf(o,"</td></tr>\n"); // only one line


fprintf(o,"<tr><td>density for Next</td>\n");
fprintf(o,"<td>\\(g(x)=\\frac{1}{c_1} \\mathrm{Student}_{N-1}\\!\\left( \\frac{x-t}{c_1}\\right) \\ ~ \\) [y.\\(^{-1}\\)]</td>\n");
fprintf(o,"<td>\\(G(L)=\\frac{1}{C_1} \\mathrm{Student}_{N-1}\\!\\left( \\frac{L-T}{C_1}\\right)\\)");
fprintf(o,"</td></tr>\n"); // only one line

fprintf(o,"<tr><td>Spread for Next</td>\n");
fprintf(o,"<td>\\(w= \\sqrt{ \\int_{-\\infty}^{\\infty} g(x) ~ (x\\!-\\!t)^2 \\ \\mathrm d x \\ }\\)<br>\n");
fprintf(o,"    \\( = \\sqrt{\\frac{N-1}{N-3}}\\ c_1 \\approx %9.6f\\ \\) [y.]</td>\n",w);
fprintf(o,"<td>\\(W= \\sqrt{ \\int_{-\\infty}^{\\infty} G(L) ~ (L\\!-\\!T)^2 \\ \\mathrm d L \\ }\\)<br>\n");
fprintf(o,"    \\( = \\sqrt{\\frac{N-1}{N-3}}\\ C_1 \\approx %9.6f\\)</td>\n",W);
fprintf(o,"</tr>\n");

fprintf(o,"<tr><td>Naive for next</td>\n");
fprintf(o,"<td>\\(\\sqrt{s^2+c^2}\\approx %9.6f ~ \\) [y.]</td>\n",sqrt(s*s+c*c));
fprintf(o,"<td>\\(\\sqrt{S^2+C^2}\\approx %9.6f \\) </td>\n",sqrt(S*S+C*C));
fprintf(o,"</tr>\n");

fprintf(o,"<tr><td>sigma interval for mean</td>\n");
fprintf(o,"<td>\\(t\\pm v\\approx %9.6f, %9.6f ~ \\) [y.]</td>\n",t-v, t+v);
fprintf(o,"<td>\\(T\\pm V\\approx %9.6f, %9.6f ~ \\)<br>\n",T-V, T+V);
fprintf(o,"\\( \\exp_2( T\\pm V) \\approx %9.6f, %9.6f ~ \\) [y.]</td>\n",pow(2.,T-V), pow(2.,T+V));
fprintf(o,"</tr>\n");


fprintf(o,"<tr><td>sigma interval for next</td>\n");
fprintf(o,"<td>\\(t\\pm w\\approx %9.6f, %9.6f ~ \\) [y.]</td>\n",t-w, t+w);
fprintf(o,"<td>\\(T\\pm W\\approx %9.6f, %9.6f ~ \\)<br>\n",T-W, T+W);
fprintf(o,"\\( \\exp_2( T\\pm W) \\approx %9.6f, %9.6f ~ \\) [y.]</td>\n",pow(2.,T-W), pow(2.,T+W));
fprintf(o,"</tr>\n");

fprintf(o,"</table>\n");
fprintf(o,"</body></html>");
fclose(o);
//system("sleep 2; open Duration5tableBig.htm"); // need pause while showing the pdf?

o=fopen("Duration5compar2.tex","w");
fprintf(o,"\\documentclass{standalone}\n");
fprintf(o,"\\usepackage{graphicx}\n");
fprintf(o,"\\usepackage{tikz}\n");
fprintf(o,"\\newcommand \\sx {\\scalebox}\n"); // no need: \Huge does the job
fprintf(o,"\\begin{document}\n");
fprintf(o,"\\Huge\n");
fprintf(o,"\\begin{tikzpicture}[scale=2]\n");
fprintf(o,"\\draw [line width=0.981] (0,0) grid (30,8);\n");
fprintf(o,"\\draw [line width=2.3] (0,8.4) -- (0,0) -- (30.1,0) ;\n");
fprintf(o,"\\draw (0,8.3) node[right] {\\sx{1.8}{\\(g(x)\\) , blue ; \\(\\frac{G(\\log_2(x))}{x \\ \\log(2)}\\) , black}};\n");
fprintf(o,"\\definecolor{light}{rgb}{1,1,.6}\n"); // warning: no need ";" after to definecolor!!
fprintf(o,"\\definecolor{dark}{rgb}{0,1,1}\n");
fprintf(o,"\\draw[line width=32, light] (8,0.03) -- (8,3.8) ;\n");
fprintf(o,"\\draw (8,0.8) node[rotate=90,right] {\\bf Russia 2028};\n");
fprintf(o,"\\draw[line width=32, light] (22,0.03) -- (22,3.8) ;\n");
fprintf(o,"\\draw(22,0.8) node[rotate=90,right] {\\bf Moscow 2042};\n");

for(n=0;n<N;n++){
fprintf(o,"\\draw[line width=24, dark] (%5.3f,0.03) -- (%5.3f,3.3) ;\n",X[n], X[n]);
fprintf(o,"\\draw (%5.3f,3.2) node[rotate=90,left] {\\bf %s %4d-%4d};\n",X[n],str[n],Ya[n],Yb[n]);
printf("%1d %s\n",n,str[n]);
                }

for(n=0;n<9;n+=1) fprintf(o,"\\draw (0,%d) node[left] {\\sx{1.3}{%4.2f}};\n",n,0.01*n);
for(n=0;n<30;n++) fprintf(o,"\\draw (%d,0) node[below] {\\sx{1.3}{%d}};\n",n,n);
                 fprintf(o,"\\draw (%d,-.1) node[below] {\\sx{1.4}{\\(x\\)}};\n",n);

printf("t=%9.6f ; c1=%9.6f\n",t,c1);
for(n=0;n<303;n+=5)
{       x=.1*n; y=100*Student(N-1,(x-t)/c1)/c1;
        if(n==0) fprintf(o,"\\draw[line width=3, blue] (0,%6.3f)",y);
        else     fprintf(o," -- (%6.3f,%6.3f)",x,y);
//printf("curve 2: %6.4f %6.4f\n",x,y);
}
fprintf(o,";\n");

printf("T=%9.6f ; T1=%9.6f\n",T,C1);
//fprintf(o,"\\draw[line width=3, black] (0,0)");
for(n=1;n<304;n+=4)
{
x=.1*n; y=100./M_LN2*Student(N-1,(log2(x)-T)/C1)/C1/x;
if(n==1) fprintf(o,"\\draw[line width=3, black] (%6.3f,%6.3f)",x,y);
//if(n==1) fprintf(o,"\\draw[line width=3, blue] (%6.3f,%6.3f)",x,y);
else     fprintf(o," -- (%6.3f,%6.3f)",x,y);
//printf("curve 2: %6.4f %6.4f\n",x,y);
}
fprintf(o,";\n");

fprintf(o,"\\end{tikzpicture}\n");
fprintf(o,"\\end{document}\n");

fclose(o);
system("pdflatex Duration5compar2.tex");
system("xpdf     Duration5compar2.pdf");

}
Warning
The code above generates also 2 other pictures and, in addition, the table of main parameters for each of the two models.
References
Keywords
File history
Click on a date/time to view the file as it appeared at that time.
| Date/Time | Thumbnail | Dimensions | User | Comment | |
|---|---|---|---|---|---|
| current | 20:09, 24 July 2025 | 1,786 × 552 (137 KB) | T (talk | contribs) | {{top}} {{fig|OliverCromwellBySamuelCooper.jpg|80|-74|2|4|Cromwell<ref name="CromwellPic">https://commons.wikimedia.org/wiki/File:Oliver_Cromwell_by_Samuel_Cooper.jpg Oliver Cromwell (1599-1658) After Samuel Cooper (1609–1672) </ref>}} {{fig|1799.11.01.NapoleonFragmentCMYK.jpg|80|2|2|4|Napoleon<ref name="napo"> https://commons.wikimedia.org/wiki/File:Buonaparte_closing_the_farce_of_Egalité.jpg Buonaparte closing the farce of Egalitè, at St. Cloud near Paris Novr. 10th. 179... |
You cannot overwrite this file.
File usage
The following page uses this file: