File:Duration5compar3.jpg
Original file (1,786 × 508 pixels, file size: 148 KB, MIME type: image/jpeg)
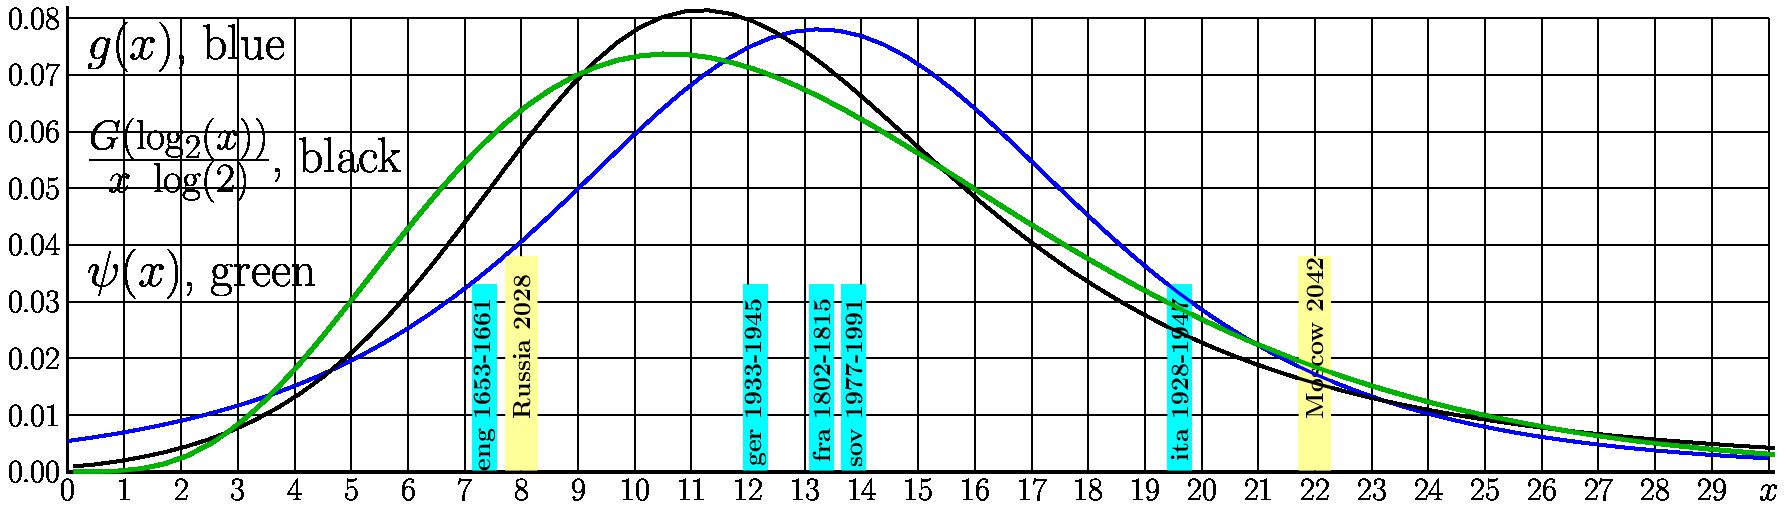
Likelihood density for next (6th) measurement of Duration based on the 5 previous measurements in 3 models:
Model First: normal distribution of Duration gives function \(g\)
Model Second: normal distribution of logarithm of Duration gives function \(h\)
Model Third: Gamma dustribution with 5 degrees of freedom gives function \(\psi\) (only the mean value is adjusted)/
The blue bars show the 5 observed values used in the comulation.
The yellow bars shod the two values from the sci-fi; these values are not taken into account in the computation.
The picture is prepared for article Duration5 (which is draft) with goal to include it also to article Duration.
The figure is generated by the C++ code together with two other pictures and the table of comparison of the first two models.
The input files and the main code are supplied below.
"i.txt"
1653 12 16 1661 04 23 eng
1802 08 04 1815 11 20 fra
1928 05 17 1947 12 27 ita
1933 03 24 1945 05 08 ger
1977 10 07 1991 08 20 sov
HtmlHeader.txt
<!DOCTYPE html><html>
<script type="text/x-mathjax-config">
MathJax.Hub.Config({
  CommonHTML: { matchFontHeight: false },
  tex2jax: {inlineMath: [['$','$'],['\\(','\\)']], processEscapes: true }
   });
</script>
<script async src="https://cdnjs.cloudflare.com/ajax/libs/mathjax/2.7.0/MathJax.js?config=TeX-AMS_CHTML"></script>
<head>
<meta charset="utf-8"/>
</head>
<body>
Main
// files ju24da.cin and Student.cin should be loaded in order to compile the code below.
// Files "i.txt" and "HtmlHeader.txt" above should be loaded in order to execute it.
#include <stdio.h>
#include <math.h>
#include <stdlib.h>
#include "ju24da.cin"
#include "Student.cin"
#define DB double
// using namespace std;
int main(){ int n,N=5; // The 6th case is not yet comleted. Here cases are numerated beginning with 0.
FILE *i,*o; // Input and Output pointers.
int Y1,M1,D1; //Year, Month, Day
int Y2,M2,D2; char str[N][4]; //just a string for each case
int Ya[N],Yb[N]; //the same as Y1,Y2, but arrays

int Days[N]; // Notaton "D" is confusive; better not to use it
double X[N]; // data for Linear scale (in years)
double L[N]; // data for Logaritmic scale
double x,y,p,q,r; // coordinates and other dummy variales

i=fopen("i.txt","r"); // input; computation of values of arrays X and L
for(n=0;n<N;n++){
fscanf(i,"%4d %2d %2d %4d %2d %2d %3s", &Y1,&M1,&D1, &Y2,&M2,&D2, str[n]); Ya[n]=Y1; Yb[n]=Y2;
Days[n]=daju24(Y2,M2,D2) - daju24(Y1,M1,D1) ; x=Days[n]/365.2422; X[n]=x; L[n]=log2(x);
printf("%4d %02d %02d %04d %02d %02d %3s %04d %6.4lf %6.4lf\n", Y1,M1,D1, Y2,M2,D2, str[n], Days[n], X[n], L[n]);
                 } fclose(i);

// Notations:
double t,T; // mean valies of data for the Linear scale and the Logarithmic scale;
double s,S; // estimates for standard error;
double c,C; // parameters of Student for mean value;
double v,V; // estimates for the standard error of the mean value (width of the distribution)
double c1,C1; // parameters of the Student Distribution for next measurement
double w,W; //estimates for the widths of distribution for the next measurement

// Linear scale
p=0.; for(n=0;n<N;n++) p+=X[n];  t=p/N; printf("tildeX=t=%5.2lf\n",t); // mean value
q=0.; for(n=0;n<N;n++) {r=X[n]-t; q+=r*r;}
s=sqrt(q/(N-1.));  printf("s=%5.2lf\n",s); // scale for standard error
c=sqrt(q/(N*(N-1.)));  printf("c =%5.2lf\n",c ); // parameter for Student for mean value
c1=s*sqrt(1.+1./N);  printf("c1=%5.2lf\n",c1); // parameter for Student for next value
v=sqrt(q/(N*(N-3.))); printf("z=%5.2lf\n",v);  // spread for the mean value
w=s*sqrt((N-1.)/(N-3.))*sqrt(1.+1./N);  printf("delta=%5.2lf\n",w);  // spread for next value

o=fopen("Duration5Li.tex","w");
fprintf(o,"\\documentclass{standalone}\n");
fprintf(o,"\\usepackage{graphicx}\n");
fprintf(o,"\\usepackage{tikz}\n");
//fprintf(o,"\\newcommand \\sx {\\scalebox}\n"); // no need: \Huge does the job
fprintf(o,"\\begin{document}\n");
fprintf(o,"\\Huge\n");
fprintf(o,"\\begin{tikzpicture}[scale=2]\n");
fprintf(o,"\\draw [line width=0.981] (0,0) grid (24,4);\n");
fprintf(o,"\\draw [line width=2.3] (0,4.4) -- (0,0) -- (24.1,0) ;\n");
fprintf(o,"\\draw (-.08,4.3) node[right] {\\(f(x), g(x)\\)};\n");
fprintf(o,"\\definecolor{light}{rgb}{1,1,.6}\n"); // warning: no need ";" after to definecolor!!
fprintf(o,"\\definecolor{dark}{rgb}{0,1,1}\n");
fprintf(o,"\\draw[line width=32, light] (8,0.03) -- (8,3.8) ;\n");
fprintf(o,"\\draw (8,0.8) node[rotate=90,right] {\\bf Russia 2028};\n");
fprintf(o,"\\draw[line width=32, light] (22,0.03) -- (22,3.8) ;\n");
fprintf(o,"\\draw(22,0.8) node[rotate=90,right] {\\bf Moscow 2042};\n");

for(n=0;n<N;n++){
fprintf(o,"\\draw[line width=24, dark] (%5.3lf,0.03) -- (%5.3lf,3.3) ;\n",X[n], X[n]);
fprintf(o,"\\draw (%5.3lf,3.2) node[rotate=90,left] {\\bf %s %4d-%4d};\n",X[n],str[n],Ya[n],Yb[n]);
printf("%1d %s\n",n,str[n]);
                }

for(n=0;n<5;n+=2) fprintf(o,"\\draw (0,%d) node[left] {%3.1f};\n",n,0.05*n);
for(n=0;n<24;n++) fprintf(o,"\\draw (%d,0) node[below] {%d};\n",n,n);
                 fprintf(o,"\\draw (%d,0) node[below] {\\(x\\)};\n",n);

printf("t=%9.6f ; c =%9.6f\n",t,c);
fprintf(o,"\\draw[line width=5, red] (0,0)");
for(n=1;n<241;n+=2)
{ x=.1*n; y=20*Student(N-1,(x-t)/c)/c;        fprintf(o," -- (%6.3f,%6.3f)",x,y);
printf("curve 1: %6.4lf %6.4lf\n",x,y);
}
fprintf(o,";\n");

printf("t=%9.6f ; c1=%9.6f\n",t,c1);
for(n=0;n<241;n+=5)
{       x=.1*n; y=20*Student(N-1,(x-t)/c1)/c1;
        if(n==0) fprintf(o,"\\draw[line width=3, blue] (0,%6.3f)",y);
        else     fprintf(o," -- (%6.3f,%6.3f)",x,y);
printf("curve 2: %6.4lf %6.4lf\n",x,y);
}
fprintf(o,";\n");
x=14.54; y=20*Student(N-1,(x-t)/c)/c;
fprintf(o,"\\draw (%5.2lf,%5.2lf) node[above] {\\(f(x)\\)};\n",x,y+.2);
//fprintf(o,";\n");

x=14.6; y=20*Student(N-1,(x-t)/c1)/c1;
fprintf(o,"\\draw (%5.2lf,%5.2lf) node[above] {\\(g(x)\\)};\n",x,y-.1);
//fprintf(o,";\n");

fprintf(o,"\\end{tikzpicture}\n");
fprintf(o,"\\end{document}\n");
fclose(o);

system("pdflatex Duration5Li.tex");
//system("open Duration5Li.pdf &");

// getchar();
// printf("The continuation is not yet ready\n");

// Logarithmic scale
p=0.; for(n=0;n<N;n++) p+=L[n];  T=p/N; printf("tildeL=T=%5.2lf\n",t); // mean value
q=0.; for(n=0;n<N;n++) {r=L[n]-T; q+=r*r;}
S=sqrt(q/(N-1.));  printf("S=%5.2lf\n",S); // scale for standard error
C=sqrt(q/(N*(N-1.)));  printf("C =%5.2lf\n",C ); // parameter for Student for mean value
C1=S*sqrt(1.+1./N);  printf("C1=%5.2lf\n",C1); // parameter for Student for next value
V=sqrt(q/(N*(N-3.))); printf("sigma=%5.2lf\n",V);  // spread for the mean value
W=S*sqrt((N-1.)/(N-3.))*sqrt(1.+1./N);  printf("Delta=%5.2lf\n",W); // spread for next value

o=fopen("Duration5Lo.tex","w");
fprintf(o,"\\documentclass{standalone}\n");
fprintf(o,"\\usepackage{graphicx}\n");
fprintf(o,"\\usepackage{tikz}\n");
//fprintf(o,"\\newcommand \\sx {\\scalebox}\n");
fprintf(o,"\\begin{document}\n");
fprintf(o,"\\Large\n");
//fprintf(o,"\\begin{tikzpicture}[scale=2]\n");
fprintf(o,"\\begin{tikzpicture}[scale=5]\n");
fprintf(o,"\\draw [line width=0.981] (0,0) grid (6,2);\n");
fprintf(o,"\\draw [line width=2.3] (0,2.2) -- (0,0) -- (6.1,0) ;\n");

fprintf(o,"\\definecolor{light}{rgb}{1,1,.6}\n");
fprintf(o,"\\definecolor{dark}{rgb}{0,1,1}\n");
fprintf(o,"\\draw[line width=12, light] (3,0.03) -- (3,1.4) ;\n");
fprintf(o,"\\draw (3,0.6) node[rotate=90,right] {\\bf Russia 2028};\n");
fprintf(o,"\\draw[line width=12, light] (%4.2f,0.03) -- (%4.2f,1.4) ;\n",log2(22.),log2(22.));
fprintf(o,"\\draw(%4.2f,0.6) node[rotate=90,right] {\\bf Moscow 2042};\n", log2(22.));

for(n=0;n<N;n++)
{
fprintf(o,"\\draw[line width=7, dark] (%5.3lf,0.04) -- (%5.3lf,0.4) ;\n",L[n], L[n]);
fprintf(o,"\\draw (%5.3lf,0.3) node[rotate=90,left] {\\bf %s};\n",L[n],str[n]);
printf("%1d %s\n",n,str[n]);
}

fprintf(o,"\\Huge\n");
fprintf(o,"\\draw (.04,2.1) node[right] {\\(F(L), G(L)\\)};\n");
for(n=0;n<3;n+=1) fprintf(o,"\\draw (0,%d) node[left] {%d};\n",n,n);
for(n=0;n<6;n++) fprintf(o,"\\draw (%d,0) node[below] {%d};\n",n,n);
                 fprintf(o,"\\draw (%d,0) node[below] {\\(L\\)};\n",n);

int m=1;
for(n=0;n<6;n++) {fprintf(o,"\\draw (%d,-0.2) node[below] {%d};\n",n,m); m*=2;}
                 fprintf(o,"\\draw (%d,-0.2) node[below] {\\(t\\), y.};\n",n);

printf("Lod scale, curve 1. T=%9.6f ; C=%9.6f\n",T,C);
fprintf(o,"\\draw[line width=5, red] (0,0)");
for(n=1;n<601;n+=2){x=.01*n; y=Student(N-1,(x-T)/C)/C;	fprintf(o," -- (%6.4lf,%6.4lf)",x,y);}
fprintf(o,";\n");

printf("Lod scale, curve 2. T=%9.6f ; C1=%9.6f\n",T,C1);
for(n=0;n<601;n+=4)
{	x=.01*n; y=Student(N-1,(x-T)/C1)/C1;
	if(n==0) fprintf(o,"\\draw[line width=3, blue] (0,%6.3f)",y);
	else     fprintf(o," -- (%6.3f,%6.3f)",x,y);
}
fprintf(o,";\n");

x=T; y=Student(N-1,(x-T)/C)/C;
fprintf(o,"\\draw (%5.2lf,%5.2lf) node[above] {\\(F(L)\\)};\n",x,y-.06);
//fprintf(o,";\n");

x=T; y=Student(N-1,(x-T)/C1)/C1;
fprintf(o,"\\draw (%5.2lf,%5.2lf) node[above] {\\(G(L)\\)};\n",x,y-.06);
//fprintf(o,";\n");

fprintf(o,"\\end{tikzpicture}\n");
fprintf(o,"\\end{document}\n");

fclose(o);
system("pdflatex Duration5Lo.tex");
//system("open Duration5Lo.pdf");

system("cp HtmlHead.txt Duration5table.htm");
o=fopen("Duration5table.htm","a");
fprintf(o,"<table border=1 cellpadding=6 cellspacing=3 style=\"border-collapse:collapse; text-align:center; border:1px solid\">\n");
// Do I need "solid:" above?
fprintf(o,"<tr><th>Quantity</th>\n");
//fprintf(o,"<th>Model First<br><small>(Normal distribution of durations)</small></th>\n");
//fprintf(o,"<th>Model Second<br><small>(Normal distribution of binary logarithms)</small></th></tr>\n");
fprintf(o,"<th><small>Normal distribution of durations)</small></th>\n");
fprintf(o,"<th><small>Normal distribution of the binary logarithms</small></th></tr>\n");

fprintf(o,"<tr><td>Distribution</td>\n");
fprintf(o,"<td>\\( X \\sim \\mathcal{N}(X_0, \\sigma_0^2) \\)</td>\n");
fprintf(o,"<td>\\( L = \\log_2 X \\sim \\mathcal{N}(L_0, \\ell_0^2) \\)</td></tr>\n");

fprintf(o,"<tr><td>mean; \\(N\\!=\\!\%d\\)</td>\n",N);
fprintf(o,"<td>\\(t=\\frac{1}{N} \\sum_{n=1}^N X_n\\approx%7.4f\\) [y.]</td>\n",t);
fprintf(o,"<td>\\(T=\\frac{1}{N} \\sum_{n=1}^N L_n\\approx%7.4f\\) <br>\n",T);
fprintf(o,"\\(\\exp_2(T)\\approx%7.4f\\) [y.]</td></tr>\n",pow(2.,T));

fprintf(o,"<tr><td>samle spread</td>\n");
fprintf(o,"<td>\\(s=\\sqrt{\\frac{1}{N-1} \\sum_{n=1}^N (X_n-t)^2}\\approx%7.4f\\) [y.]</td>\n",s);
fprintf(o,"<td>\\(S=\\sqrt{\\frac{1}{N-1} \\sum_{n=1}^N (L_n-T)^2}\\approx%7.4f\\)\n",S);
fprintf(o,"</td></tr>\n"); // only one line

fprintf(o,"<tr><td>scale for Student</td>\n");
fprintf(o,"<td>\\(c=\\sqrt{\\frac{1}{(N-1)N} \\sum_{n=1}^N (X_n\\!-\\!t)^2}\\approx%7.4f\\) [y.]</td>\n",c);
fprintf(o,"<td>\\(C=\\sqrt{\\frac{1}{(N-1)N} \\sum_{n=1}^N (L_n\\!-\\!T)^2}\\approx%7.4f\\)\n",C);
fprintf(o,"</td></tr>\n"); // only one line

fprintf(o,"<tr><td>Density for mean</td>\n");
fprintf(o,"<td>\\(f(x)=\\frac{1}{c} \\mathrm{Student}_{N-1}\\!\\left( \\frac{x-t}{c}\\right) \\ ~ \\) [y.\\(^{-1}\\)]</td>\n");
fprintf(o,"<td>\\(F(L)=\\frac{1}{C} \\mathrm{Student}_{N-1}\\!\\left( \\frac{L-T}{C}\\right)\\)");
fprintf(o,"</td></tr>\n"); // only one line


fprintf(o,"<tr><td>Spread for mean</td>\n");
fprintf(o,"<td>\\(v= \\sqrt{ \\int_{-\\infty}^{\\infty} f(x) ~ (x\\!-\\!t)^2 \\ \\mathrm d x \\ }\\)<br>\n");
fprintf(o,"    \\( = \\sqrt{\\frac{N-1}{N-3}}\\ c \\approx %7.4f\\ \\) [y.]</td>\n",v);
fprintf(o,"<td>\\(V= \\sqrt{ \\int_{-\\infty}^{\\infty} F(L) ~ (L\\!-\\!T)^2 \\ \\mathrm d L \\ }\\)<br>\n");
fprintf(o,"    \\( = \\sqrt{\\frac{N-1}{N-3}}\\ C \\approx %7.4f\\)</td>\n",V);
fprintf(o,"</tr>\n");

fprintf(o,"<tr><td>scale for Next</td>\n");
fprintf(o,"<td>\\(c_1 = s \\sqrt{1+1/N}\\approx%7.4f\\) [y.]</td>\n",c1);
fprintf(o,"<td>\\(C_1 = S \\sqrt{1+1/N}\\approx%7.4f\\)\n",C1);
fprintf(o,"</td></tr>\n"); // only one line

fprintf(o,"<tr><td>density for Next</td>\n");
fprintf(o,"<td>\\(g(x)=\\frac{1}{c_1} \\mathrm{Student}_{N-1}\\!\\left( \\frac{x-t}{c_1}\\right) \\ ~ \\) [y.\\(^{-1}\\)]</td>\n");
fprintf(o,"<td>\\(G(L)=\\frac{1}{C_1} \\mathrm{Student}_{N-1}\\!\\left( \\frac{L-T}{C_1}\\right)\\)");
fprintf(o,"</td></tr>\n"); // only one line

fprintf(o,"<tr><td>Spread for Next</td>\n");
fprintf(o,"<td>\\(w= \\sqrt{ \\int_{-\\infty}^{\\infty} g(x) ~ (x\\!-\\!t)^2 \\ \\mathrm d x \\ }\\)<br>\n");
fprintf(o,"    \\( = \\sqrt{\\frac{N-1}{N-3}}\\ c_1 \\approx %7.4f\\ \\) [y.]</td>\n",w);
fprintf(o,"<td>\\(W= \\sqrt{ \\int_{-\\infty}^{\\infty} G(L) ~ (L\\!-\\!T)^2 \\ \\mathrm d L \\ }\\)<br>\n");
fprintf(o,"    \\( = \\sqrt{\\frac{N-1}{N-3}}\\ C_1 \\approx %7.4f\\)</td>\n",W);
fprintf(o,"</tr>\n");

fprintf(o,"<tr><td>Naive for next</td>\n");
fprintf(o,"<td>\\(\\sqrt{s^2+c^2}\\approx %7.4f ~ \\) [y.]</td>\n",sqrt(s*s+c*c));
fprintf(o,"<td>\\(\\sqrt{S^2+C^2}\\approx %7.4f \\) </td>\n",sqrt(S*S+C*C));
fprintf(o,"</tr>\n");

fprintf(o,"<tr><td>sigma interval for mean</td>\n");
fprintf(o,"<td>\\(t\\pm v\\approx %7.4f, %7.4f ~ \\) [y.]</td>\n",t-v, t+v);
fprintf(o,"<td>\\(T\\pm V\\approx %7.4f, %7.4f ~ \\)<br>\n",T-V, T+V);
fprintf(o,"\\( \\exp_2( T\\pm V) \\approx %7.4f, %7.4f ~ \\) [y.]</td>\n",pow(2.,T-V), pow(2.,T+V));
fprintf(o,"</tr>\n");


fprintf(o,"<tr><td>sigma interval for next</td>\n");
fprintf(o,"<td>\\(t\\pm w\\approx %7.4f, %7.4f ~ \\) [y.]</td>\n",t-w, t+w);
fprintf(o,"<td>\\(T\\pm W\\approx %7.4f, %7.4f ~ \\)<br>\n",T-W, T+W);
fprintf(o,"\\( \\exp_2( T\\pm W) \\approx %7.4f, %7.4f ~ \\) [y.]</td>\n",pow(2.,T-W), pow(2.,T+W));
fprintf(o,"</tr>\n");

fprintf(o,"</table>\n");

fprintf(o,"<br>\n   t=%9.6lf\n",t);
fprintf(o,"t/sqrt(5.)=%9.6lf\n",t/sqrt(5.));

fprintf(o,"</body></html>");
fclose(o);
//system("sleep 2; open Duration5table.htm"); // need pause while showing the pdf?

o=fopen("Duration5compar3.tex","w");
fprintf(o,"\\documentclass{standalone}\n");
fprintf(o,"\\usepackage{graphicx}\n");
fprintf(o,"\\usepackage{tikz}\n");
fprintf(o,"\\newcommand \\sx {\\scalebox}\n"); // no need: \Huge does the job
fprintf(o,"\\begin{document}\n");
fprintf(o,"\\Huge\n");
fprintf(o,"\\begin{tikzpicture}[scale=2]\n");
fprintf(o,"\\draw [line width=0.981] (0,0) grid (30,8);\n");
/*
fprintf(o,"\\draw [line width=2.3] (0,8.4) -- (0,0) -- (30.1,0) ;\n");
fprintf(o,"\\draw (0,8.3) node[right] {\\sx{1.8}{\\(g(x)\\) , blue ; \\(\\frac{G(\\log_2(x))}{x \\ \\log(2)}\\) , black}};\n");
*/

fprintf(o,"\\draw [line width=0.981] (0,0) grid (30,8);\n");
fprintf(o,"\\draw [line width=2.3] (0,8.2) -- (0,0) -- (30.1,0) ;\n");
fprintf(o,"\\draw (0.2,7.5) node[right] {\\sx{2}{\\(g(x)\\), blue}};\n");
fprintf(o,"\\draw (0.2,5.5) node[right] {\\sx{2}{\\(\\frac{G(\\log_2(x))}{x \\ \\log(2)}\\), black}};\n");
fprintf(o,"\\draw (0.2,3.5) node[right] {\\sx{2}{\\(\\psi(x)\\), green}};\n");
//fprintf(o,"\\draw (0,8.3) node[right] {\\sx{1.8}{Likelihood density}};\n");
fprintf(o,"\\definecolor{gree}{rgb}{0,.7,0}\n");
fprintf(o,"\\definecolor{light}{rgb}{1,1,.6}\n"); // warning: no need ";" after to definecolor!!
fprintf(o,"\\definecolor{dark}{rgb}{0,1,1}\n");
fprintf(o,"\\draw[line width=32, light] (8,0.03) -- (8,3.8) ;\n");
fprintf(o,"\\draw (8,0.8) node[rotate=90,right] {\\bf Russia 2028};\n");
fprintf(o,"\\draw[line width=32, light] (22,0.03) -- (22,3.8) ;\n");
fprintf(o,"\\draw(22,0.8) node[rotate=90,right] {\\bf Moscow 2042};\n");

for(n=0;n<N;n++){
fprintf(o,"\\draw[line width=24, dark] (%5.3lf,0.03) -- (%5.3lf,3.3) ;\n",X[n], X[n]);
fprintf(o,"\\draw (%5.3lf,3.2) node[rotate=90,left] {\\bf %s %4d-%4d};\n",X[n],str[n],Ya[n],Yb[n]);
printf("%1d %s\n",n,str[n]);
                }

for(n=0;n<9;n+=1) fprintf(o,"\\draw (0,%d) node[left] {\\sx{1.3}{%4.2f}};\n",n,0.01*n);
for(n=0;n<30;n++) fprintf(o,"\\draw (%d,0) node[below] {\\sx{1.3}{%d}};\n",n,n);
                 fprintf(o,"\\draw (%d,-.1) node[below] {\\sx{1.4}{\\(x\\)}};\n",n);

printf("t=%9.6f ; c1=%9.6f\n",t,c1);
for(n=0;n<304;n+=4)
{       x=.1*n; y=100*Student(N-1,(x-t)/c1)/c1;
        if(n==0) fprintf(o,"\\draw[line width=3, blue] (0,%6.3f)",y);
        else     fprintf(o," -- (%6.3f,%6.3f)",x,y);
//printf("curve 2: %6.4lf %6.4lf\n",x,y);
}
fprintf(o,";\n");

printf("T=%9.6f ; T1=%9.6f\n",T,C1);
//fprintf(o,"\\draw[line width=3, black] (0,0)");
printf("T,C1=%20.16lf %20.16lf\n",T,C1);
for(n=1;n<304;n+=4)
{
x=.1*n; y=100./M_LN2*Student(N-1,(log2(x)-T)/C1)/C1/x;
if(n==1) fprintf(o,"\\draw[line width=3, black] (%6.3f,%6.3f)",x,y);
//if(n==1) fprintf(o,"\\draw[line width=3, blue] (%6.3f,%6.3f)",x,y);
else     fprintf(o," -- (%6.3f,%6.3f)",x,y);
//printf("curve 2: %6.4lf %6.4lf\n",x,y);
}
fprintf(o,";\n");

DB c2=c1*c1;
/*
c2*=(N-1.)/(N-3.);
//alpha thetа = t
//alpha theta^2 = c2
DB theta=c2/t;
DB alpha = t*t/c2;
DB gamma=1./tgamma(alpha)*pow(theta,alpha));
printf("atg= %20.14lf %20.14lf %20.14lf\n", alpha, theta, gamma);
//atg=     7.60804482962240     1.74155625385887     0.00000635471269
// y=gamma*pow(x,alpha-1.)*exp(-x/theta);
*/
DB alpha=5;
DB theta=t/alpha;
DB gamma=1./(tgamma(alpha)*pow(theta,alpha));
printf("atg= %20.14lf %20.14lf %20.14lf\n", alpha, theta, gamma);

for(n=1;n<304;n+=4)
{
x=.1*n; y=100.*gamma*pow(x,alpha-1.)*exp(-x/theta);
if(n==1) fprintf(o,"\\draw[line width=4, gree] (%6.3f,%6.3f)",x,y);
else     fprintf(o," -- (%6.3f,%6.3f)",x,y);
}
fprintf(o,";\n");

fprintf(o,"\\end{tikzpicture}\n");
fprintf(o,"\\end{document}\n");

fclose(o);
system("pdflatex Duration5compar3.tex");
system("open    Duration5compar3.pdf");
}
Warning
References
Keywords
«Duration», «Duration5», «Duration5tableBig», «C++», «Collapse of RF», «tgamma», «HTML», «ju24da.cin», «Latex», «Student Distribution», «Student.cin», «tikz»,
File history
Click on a date/time to view the file as it appeared at that time.
| Date/Time | Thumbnail | Dimensions | User | Comment | |
|---|---|---|---|---|---|
| current | 20:43, 26 July 2025 | 1,786 × 508 (148 KB) | T (talk | contribs) | == Summary == {{oq|Duration5compar3.jpg|}} Likelihood density for next (6th) measurement of Duration based on the 5 previous measurements; the 3 curves refer to the 3 models: Model First: normal distribution of Duration gives function \(g\) Model Second: normal distribution of logarithm of Duration gives function \(h\) Model Third: Gamma distribution with 5 degrees of freedom gives function \(\psi\) (only the mean value is adjusted)/ The blue bars show the 5 observed values used in t... |
You cannot overwrite this file.
File usage
The following 5 pages use this file: