File:Itelin125T.jpg
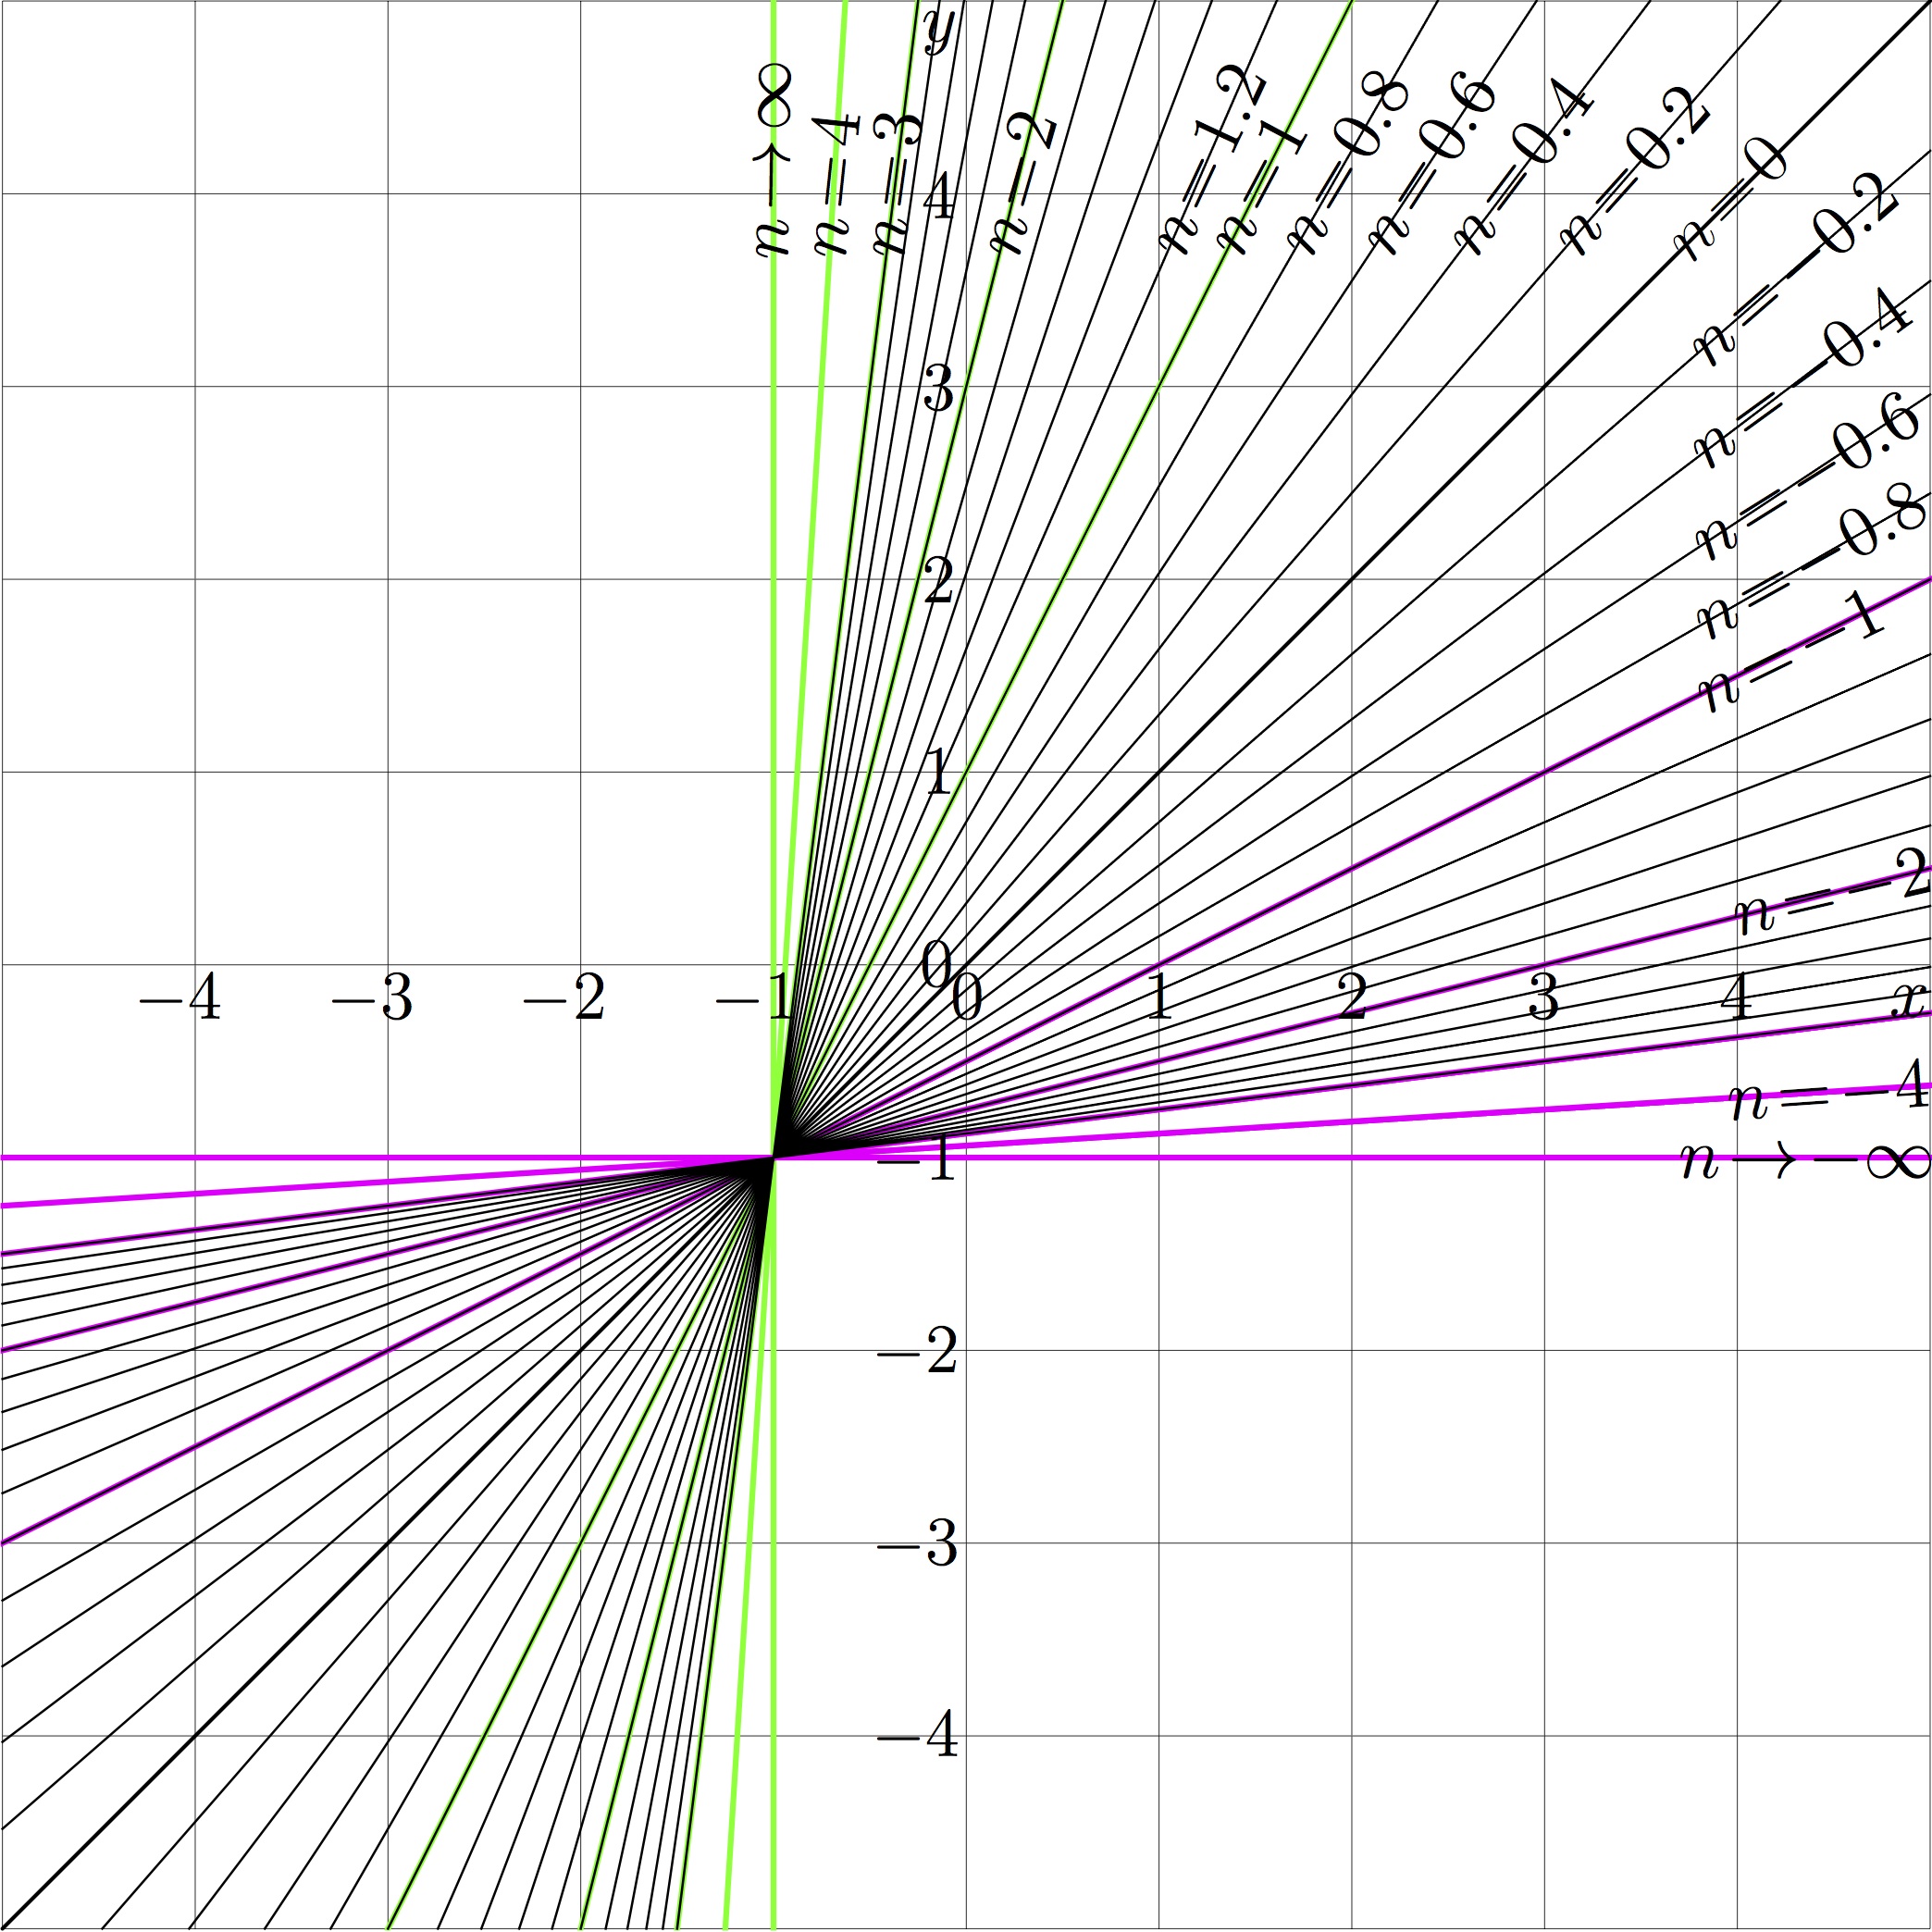
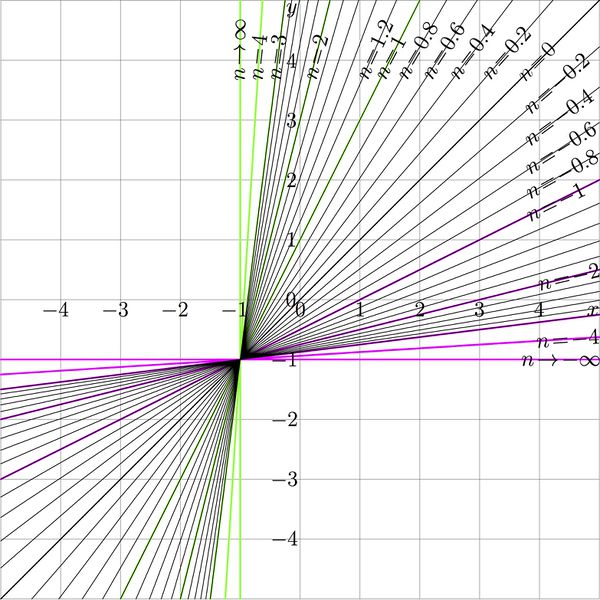
Iterates of the linear function
$T(z)=A+B z$
for $A\!=\!1$, $B\!=\!2$
$y=T^n(x)$ is plotted versus $x$ for various values of $n$.
C++ Generator of lines
// File ado.cin should be loaded in the working directory in order to compile the C++ code below
//
#include<math.h>
#include<stdio.h>
#include<stdlib.h>
#define DO(x,y) for(x=0;x<y;x++)
#define DB double
#include"ado.cin"
DB A=1.0000;
DB B=2.000;
DB T(DB c,DB x){ DB Bc=pow(B,c); return A*(Bc-1.)/(B-1.) + Bc*x; }
DB U(DB c,DB x){ DB Bc=pow(B,c); return (x-A*(Bc-1.)/(B-1.))/Bc; }
int main(){ FILE *o; int m,n,k; DB c, x,y,t;
o=fopen("itelin125.eps","w");
ado(o,1002,1002);
#define M(x,y) fprintf(o,"%7.4f %7.4f M\n",0.+x,0.+y);
#define L(x,y) fprintf(o,"%7.4f %7.4f L\n",0.+x,0.+y);
fprintf(o,"501 501 translate 100 100 scale 2 setlinecap\n");
for(n=-5;n<6;n++) { M(-5,n)L(5,n)}
for(m=-5;m<6;m++) { M(m,-5)L(m,5)}
fprintf(o,".004 W S\n");
c= 40.001; x=-5.;y=T(c,x); if(y<-5.){y=-5.;x=U(c,y);} M(x,y);x=5.;y=T(c,x); if(y>5.){y=5.;x=U(c,y);}L(x,y);fprintf(o,".03 W 0 1 0 RGB S\n");
c= 4.000001; x=-5.;y=T(c,x); if(y<-5.){y=-5.;x=U(c,y);} M(x,y);x=5.;y=T(c,x); if(y>5.){y=5.;x=U(c,y);}L(x,y);fprintf(o,".03 W 0 1 0 RGB S\n");
c= 3.000001; x=-5.;y=T(c,x); if(y<-5.){y=-5.;x=U(c,y);} M(x,y);x=5.;y=T(c,x); if(y>5.){y=5.;x=U(c,y);}L(x,y);fprintf(o,".03 W 0 1 0 RGB S\n");
c= 2.000001; x=-5.;y=T(c,x); if(y<-5.){y=-5.;x=U(c,y);} M(x,y);x=5.;y=T(c,x); if(y>5.){y=5.;x=U(c,y);}L(x,y);fprintf(o,".03 W 0 1 0 RGB S\n");
c= 1.000001; x=-5.;y=T(c,x); if(y<-5.){y=-5.;x=U(c,y);} M(x,y);x=5.;y=T(c,x); if(y>5.){y=5.;x=U(c,y);}L(x,y);fprintf(o,".03 W 0 1 0 RGB S\n");
c= 0.000001; x=-5.;y=T(c,x); if(y<-7.){y=-5.;x=U(c,y);} M(x,y);x=5.;y=T(c,x); if(y>5.){y=5.;x=U(c,y);}L(x,y);fprintf(o,".02 W 0 0 0 RGB S\n");
c=-1.000001; x=-5.;y=T(c,x); if(y<-5.){y=-5.;x=U(c,y);} M(x,y);x=5.;y=T(c,x); if(y>5.){y=5.;x=U(c,y);}L(x,y);fprintf(o,".03 W 1 0 1 RGB S\n");
c=-2.000001; x=-5.;y=T(c,x); if(y<-5.){y=-5.;x=U(c,y);} M(x,y);x=5.;y=T(c,x); if(y>5.){y=5.;x=U(c,y);}L(x,y);fprintf(o,".03 W 1 0 1 RGB S\n");
c=-3.000001; x=-5.;y=T(c,x); if(y<-5.){y=-5.;x=U(c,y);} M(x,y);x=5.;y=T(c,x); if(y>5.){y=5.;x=U(c,y);}L(x,y);fprintf(o,".03 W 1 0 1 RGB S\n");
c=-4.000001; x=-5.;y=T(c,x); if(y<-5.){y=-5.;x=U(c,y);} M(x,y);x=5.;y=T(c,x); if(y>5.){y=5.;x=U(c,y);}L(x,y);fprintf(o,".03 W 1 0 1 RGB S\n");
c=-40.0001; x=-5.;y=T(c,x); if(y<-5.){y=-5.;x=U(c,y);} M(x,y);x=5.;y=T(c,x); if(y>5.){y=5.;x=U(c,y);}L(x,y);fprintf(o,".03 W 1 0 1 RGB S\n");
DO(n,31){c=-3.000001+.2*n; x=-5.;y=T(c,x); if(y<-5.){y=-5.;x=U(c,y);} M(x,y);x=5.;y=T(c,x); if(y>5.){y=5.;x=U(c,y);}L(x,y);}
fprintf(o,".012 W 0 0 0 RGB S\n");
fprintf(o,"showpage\n"); fprintf(o,"%c%cTrailer\n",'%','%');
fclose(o);
system("epstopdf itelin125.eps");
system( "open itelin125.pdf");
}
//
Latex generator of curves
File history
Click on a date/time to view the file as it appeared at that time.
| Date/Time | Thumbnail | Dimensions | User | Comment | |
|---|---|---|---|---|---|
| current | 19:00, 18 September 2013 | | 2,088 × 2,088 (893 KB) | T (talk | contribs) | Iterates of the linear function $T(z)=A+B z$ for $A\!=\!1$, $B\!=\!2. $y=T^n(x)$ is plotted versus $x$ for various values of $n$. Category:Linear function Category:Iteration Category:Explicit plot Category:C++ Cateogry:Latex |
- You cannot overwrite this file.
File usage
The following page links to this file: