Mapping
Mapping means function from some space to itself or to another space, and also the graphical representation of such a function. Such a representation is called map.
Often, mapping refers to the representation of bi-dimesional objects, for example, in topography, the surface of the Earth (or that of another planet) is mapped to the surface of a globe or to a flat picture at the surface of a monitor of computer, or to the image printed on a piece of paper.
Variety of mappings
In genetics, mapping refer to the single-dimensional distribution of genes along the chromosomes. Such a concept is used in the gen enginery helping to make relations between species and/or creation of new species.
In Astrophysics, the mapping may refer also to the spacial distribution of stars, galaxies, clusters of galaxies. Historically, the spherical system of coordinates is used; the Equatorial coordinates determine the projection of an object to the sky sphere, while the distance to the object is determined by the parallax The two coordinates of an object are determined by the equatorial coordinates (which are analogy of those in geography and usually are determined with several decimal digits, while the distance to the object is measured using the parallax (for claw objects) or the redshift, assuming the model of the expanding universe (for far clusters of galaxies).
Often, the astrophysicists and Geophysicists use some mapping without to know what kind of function realizes the mapping. The astrophysicists use the so-called galactic coordinates without to determine the position of the pole of the galaxy of without to determine the piston of the galactic meridian at the sky sphere. Similarly, the geophysicists use some maps without to know what kind of function (it is called "projection") relates the position of a point on the surface of the Earth to the corresponding point of the map. In both cases, it is assumed that "everybody knows" the specific kind of mapping, that is represented in the published tables or in the software. Practically this means that there is no explicit description of the mapping used; so the picture may be considered as an artisitic work, but close to useless from the scientific point of view.
For the scientific applications of the mapping, the kind of mapping used in each case should be carefully determined ane explicitly specified in each case. (Over-vice, the results of different approaches cannot be compared and the research does not satisfy the axioms of Science).
In Mathematics, mapping refers to a function that is defined on some metric space and the returned value also belongs to the same metric space.
Mapping of a metric space
Set \(M\) is qualified as a metric space, if at least one function \(d\) is defined on the pair of the elements of this space, and
Examples of mapping
Mapping of a real function of two real variables
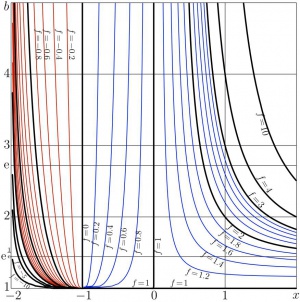
The real function of two real variables can be represented graphically with the contour plot. Such a plot shows the map of the function. In figure at right, the contour plot of the tetration \({\rm tet}_b(x)\) is shown in the \(x,b\) coordinates.
The tetrational [1][2][3][4][5] is holomorphic solution \(F(z)={\rm tet}_b(z)\) of the equations
- \(F(z+1)=b^{F(z)}\),
- \(F(0)=1\)
At real values of \(b>1\) and real values of \(z>-2\), the tetrational \({\rm tet}_b(z)\) is also real and looks a continuous function. The map of this function may be interpreted as a hint that the tetrational is holomorphic not only being considered as function of \(z\) at fixed \(b\), but also as function of \(b\) at fixed \(z\). However, the graphical smoothness of the plot at the picture cannot substitute the mathematical proof.
For the plotting of the maps of a function of two real variables, the function contour plot can be used. The code for such a function and Several examples can be found at Citizendium [6]
Complex map

For visualization of the functions of complex variable, the complex map are used. The real part of a complex function, as well as its imaginary part can be considered as function of two real arguments: the real part of the complex argument and the imaginary part of the argument. The lines of level of each of these two functions, id est, the real part and the imaginary part, can be plotted at the same graphic, forming the complex map. For the holomorphic functions, the levels of constant real part are orthogonal to the lines of constant imaginary part; so, together they form the specific mesh-like structure.
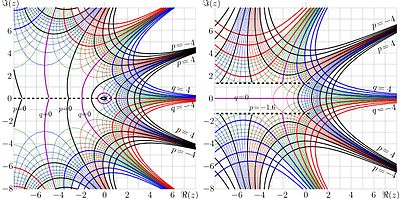
In the figure, the complex maps of the two functions are shown: the square root of factorial and the \(\sqrt{\exp}\). The first of them is currently used as logo of the Physics Department of the Moscow State University and as part of logo of TORI (see left upper corner of the page).
The square root of factorial, or \(f=\sqrt{ \,!\, }\) is holomorphic function such that \(f(f(z))=z!={\rm Factorial}(z)\).
The square root of exponential, or \(f=\sqrt{\exp}\) is holomorphic function such that \(f(f(z))=\exp(z)\).
Such functions can be built-up using the apparatus of superfunctions; in the similar way, various non-integer (and even complex) iterates of various holomorphic functions can be built-up, and the complex mapping is important tool for their graphical representation. These functions have non-trivial asymptotic properties (for example, the growth faster than any polynomial, but slower than any exponential) and may open the new branch in the simulation of complicated processes. The image above is borrowed from Citizendium, [7]. Such functions are under investigation since the middle of the 20th century [8][9][10].
Geographic map
In geography, the coordinate of a point at the surface of the Earth is often determined with the geographic latitude \(\alpha\) and the geographic longitude \(\delta\). In the first approximation, the Earth is assumed to be a sphere, while the vertical profile (hills, mounts, gaps, creeks) is treated as the perturbation.
\(\alpha\) determines the angle between the ray from the center of the Earth and the equatorial plane.
\(\delta\) determines the angle between the meridian through the point and the Greenwich meridian (that goes through the historic astronomical observatory in London).
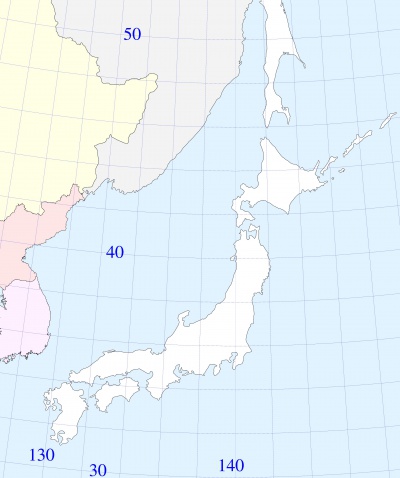
For example, to plot the figure at right, the following mapping from the geographic coordinates \(\alpha,\delta\) to the Cartesian coordinates \(x,y\) at the plane of the screen is used (Below, all variables are real numbers):
\(\rm Degree=\pi/180\)
\(\alpha_0=40~ \rm Degree\)
\(\delta_0=140~ \rm Degree\)
\(c=\cos(\alpha_0)\)
\(\rho=\cos(\alpha_0)/\sin(\alpha_0)\)
\(r=\rho-(\alpha\!-\!\alpha_0)\)
\(\varphi=(c/\rho) (\delta\!-\!\delta_0)\)
\(x=r \sin(\varphi)\)
\(y=\rho-r \cos(\varphi)\)
The images of the parallels and meridians are shown with blue lines. The images of the coasts of the Sea are shown with black lines. The Mathematica software and the Google map are used to draw these lines. (Evaluations of \(\delta\) in Mathematica seem to have value for a percent smaller than than in Google; such a difference is small and is not seen at the plot.)
The scale of the map determines the relation of distance between two points at the surface of the Earth to the distance between their images at the map. At the central part of the figure, the unity length at the map corresponds to the distance \(R=6400\)km at the surface, that has physical meaning of radius of the Earth. (The width of the mapped range is about 2 megameter, that is smaller than radius of the Earth.)
In the poor-quality scientific publications (as well as in the pseudo-scientific sources), at the use of maps, the explicit formula that determines the mapping is not specified. This aspect of the mapping is discussed also in the article Халтура (In Russian).
Mapping of the phase space

The phase space is built on parameters (coordinate, momentum). Usually it is assumed that these coordinate and momentum correspond to the same degree of freedom. In the simplest case, the system has only one degree of freedom, and then the phase space is bi-dimensional. The state of a system can be characterized with its distribution in the coordinate-momentum space. The measure of the region, occupied by the system preserves during the unitary evolution of the hamiltonian system, this is determined by the famous Liuvill theorem about the conservation of the volume in the phase space at the evolution of an isolated system.
However, if the system interacts with some environment, the volume in the system's phase space has no need to conserve. But even in this case, there are certain fundamental restrictions, that do not allow the arbitrary transformation. These restrictions come from the Quantum Mechanics. Aiming the application to the Quantum optics, the special scaling of coordinates is assumed, in such a way that the coordinates in the phase space can be interpreted as real and imaginary parts of the annihilation operator \(\hat a\).
The phase space may be used for the description of evolution of a quantum state of a simple system, for example, the state of the field in some fixed mode of a light pulse. Any transform of this state can be considered as the amplification. The attenuation can be interpreted as amplification at the amplification coefficient with modulus smaller than unity. The effective amplification coefficient can defined as ratio \(\langle\hat A\rangle / \langle \hat a \rangle\), where \(\hat a\) is operator of annihilation before the amplification, and \(\hat A=\hat U \hat a \hat U^\dagger\) is the annihilation operator after the amplification; \(\hat U\) is the operator of evolution.
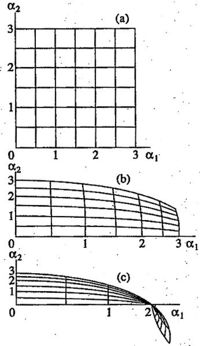
For the mapping, the annihilation operator is presented as the sum of its Hermitian part and its anti-Hermitian part, id est, \(\hat a= \hat a_1 + \hat a_2\). Then, the classical phase space is formed with coordinates \(\alpha_1=\langle \hat a_1 \rangle\) and \(\alpha_2=\langle \hat a_2 \rangle\). The evolution of the uncertainty body is characterized with the mapping of the phase space.
The quantum noise at the amplification is limited from below; the lower limit is determined by the shape of the mapping function. Several lower bounds can be deduced from the postulates of Quantum Mechanics [11] [12]. In particular, the lower bound of noise prohibits the reduction of the noise of the photo-detecting system by the pre-amplification of the weak signal before the registration (whenever the linear or nonlinear amplifier is used).
References
- ↑ http://www.ams.org/journals/mcom/2010-79-271/S0025-5718-10-02342-2/home.html D.Kouznetsov, H.Trappmann. Portrait of the four regular super-exponentials to base sqrt(2). Mathematics of Computation, 2010, v.79, p.1727-1756.
- ↑ http://www.ils.uec.ac.jp/~dima/PAPERS/2011e1e.pdf H.Trappmann, D.Kouznetsov. Computation of the Two Regular Super-Exponentials to base exp(1/e). Preprint ILS, 2011.
- ↑ http://www.ams.org/mcom/2009-78-267/S0025-5718-09-02188-7/home.html D.Kouznetsov. (2009). Solutions of \(F(z+1)=\exp(F(z))\) in the complex plane.. Mathematics of Computation, 78: 1647-1670. DOI:10.1090/S0025-5718-09-02188-7.
- ↑ http://www.ils.uec.ac.jp/~dima/PAPERS/2010vladie.pdf D.Kouznetsov. Superexponential as special function. Vladikavkaz Mathematical Journal, 2010, v.12, issue 2, p.31-45.
- ↑ http://www.springerlink.com/content/u7327836m2850246/ H.Trappmann, D.Kouznetsov. Uniqueness of Analytic Abel Functions in Absence of a Real Fixed Point. Aequationes Mathematicae, v.81, p.65-76 (2011)
- ↑ http://en.citizendium.org/wiki/Contour_plot
- ↑ http://en.citizendium.org/wiki/Image:QFacQexp.jpg Complex maps of the square root of factorial and the square root of the exponential
- ↑ http://www.ils.uec.ac.jp/~dima/Relle.pdf H.Kneiser. "Reelle analytische L¨osungen der Gleichung \(\varphi(\varphi(x))=e^x\) und verwandter Funktionalgleichungen". Journal fur die reine und angewandte Mathematik 187: 56-67. (1950, In German)
- ↑ http://www.springerlink.com/content/qt31671237421111/fulltext.pdf?page=1 D.Kouznetsov, H.Trappmann. Superfunctions and square root of factorial. Moscow University Physics Bulletin, 2010, v.65, No.1, p.6-12. (Russian version: p.8-14) http://www.springerlink.com/content/qt31671237421111/fulltext.pdf?page=1
- ↑ http://www.springerlink.com/content/u712vtp4122544x D.Kouznetsov. Holomorphic extension of the logistic sequence. Moscow University Physics Bulletin, 2010, No.2, p.91-98. (Russian version: p.24-31)
- ↑ Jump up to: 11.0 11.1 http://www.ils.uec.ac.jp/~dima/PAPERS/rohrlich.pdf D. Kouznetsov, D. Rohrlich. Quantum noise in the mapping of phase space. Optics and Spectroscopy, July 1997, v.83, N6, p.909-913
- ↑ D. Kouznetsov, R. Ortega, D. Rohrlich. Quantum limit of noise in nonlinear phase-invariant amplifiers. -- Physical Review A, 1995, v.52, N.2, p.1665-1669
http://reference.wolfram.com/mathematica/guide/GeographicData.html

