Search results
Create the page "Linear function" on this wiki! See also the search results found.
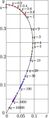
File:Nembrant.jpg [[Parametric plot]] of the branchpoint of function [[ArqNem]]$_q$, where $z=\mathrm{NemBran}(q)$ is branchpoint of function(361 × 871 (65 KB)) - 08:44, 1 December 2018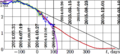
File:Ruble85210a.png The black straight line represents the [[linear approximation]] from 2014.10.27. This function reproduces the same root singularity at $x=b/(2a)$, as the elliptic approxi(1,519 × 689 (217 KB)) - 08:50, 1 December 2018- with function daju24 defined below in C++: \rm Linear &227.323 - 0.583872 x &\! 10.52733 &\! 13.15973\\5 KB (433 words) - 18:47, 30 July 2019
- ...eight:12px">Fig.1. Approximation of ruble in the USA penny (green): linear function (black), circle (pink), ellipse (red)</p> ...of rouble, expressed in yen, USA cents and Euro cents, with [[holomorphic function|holomorphic]] functions of time.18 KB (2,080 words) - 13:48, 1 February 2022
- <!--[[File:Rusa2014.10.28t.jpg|400px|thumb|Linear approximation (made 2014.10.27) of price of rouble and data by <ref> https: ...ing 2014 November, the drop of price of ruble looks to be faster, than the linear extrapolation.34 KB (944 words) - 07:01, 1 December 2018
- ...an in spherical coordinates]] is often used for separation of variables in linear equations with central symmetry. or any linear combination of these two solutions; continuity of the wave function implies that \(m\) is integer.8 KB (1,254 words) - 18:44, 30 July 2019
- [[Legendre function]] is solution \(F\) of equation For \(\ell\!=\!1\), the solution is linear function.3 KB (442 words) - 18:44, 30 July 2019
- [[File:TangentGraphic2.png|300px|thumb|Linear approximation of a smooth function <ref>http://en.wikipedia.org/wiki/Linear_approximation ...mation]] refers to the simple model of any phenomenon, based on the linear function.4 KB (670 words) - 18:46, 30 July 2019
- [[File:MoriplotFragment.jpg|400px|thumb| [[Morinaga function]] and the principal Bessel mode]] [[Morinaga function]] \(\displaystyle15 KB (2,303 words) - 18:47, 30 July 2019
- ...tation of a function, continuous at least along the real axis, through the linear combination of equidistantly–displaced functions [[sinc]]: at zero sinc is defined to be unity; then sinc appears to be [[entire function]].6 KB (944 words) - 18:48, 30 July 2019
- any state of this system is determined with the wave function \(\Psi\), ...er equation]], used to construct a [[regular iterate]]s of a [[holomorphic function]] at its [[fixed point]].4 KB (641 words) - 18:43, 30 July 2019
- [[Nemtsov function and its iterates]] is article about the [[Nemtsov function]], adaptation from version, prepared for publication, with goal to check th The Nemtsov function appears as polynomial15 KB (2,392 words) - 11:05, 20 July 2020
- ...m; the Hamiltonian is [[Hermitian operator]] acting on the elements of the linear space mentioned in the Axiom Q1; in one of representations, the evolution o Q3. The measurable quantities of classical mechanics correspond to the linear [[Hemitian operator]]s acting on the space of the states; the Hamiltonian6 KB (913 words) - 16:02, 26 July 2019
- ...state of the physical system is described with [[wavefunction]] (or [[wave function]]), that is element of the [[space]]. the linear combination4 KB (618 words) - 18:44, 30 July 2019
- ...of the statistical significance of a “second” peak at the correlation function, ...on is analysed. A theorem on the evolution of the fourth-order correlation function is presented. It provides the proof of the stability of the fundamental sol101 KB (14,271 words) - 20:58, 25 September 2020
- ...of the statistical significance of a “second” peak at the correlation function, using the Poissonian model of random (independent) distribution, that can ...ture for years 1989-2020, fit them with linear function and with quadratic function, and check, if the raise of mean temperature accelerates during 30 years si101 KB (14,846 words) - 00:35, 21 March 2023
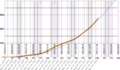
File:2021.12.05.RuDcomp.png The Bblue curve shows the approximation/exrapolation \(F\) with elementary function ...faster than quadratic; the daily death tall grows a little bit faster than linear.(1,483 × 870 (231 KB)) - 09:55, 5 December 2021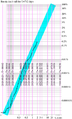
File:CovidRussiaDeath29.png The cyan strip represents the linear approximation and extrapolation. function line($x,$y,$u,$v,$c,$w)(467 × 775 (87 KB)) - 04:24, 3 January 2022


