Search results
Create the page "Contour plot" on this wiki! See also the search results found.
- ...Such a plot shows the map of the function. In figure at right, the contour plot of the [[tetration]] \({\rm tet}_b(x)\) is shown in the \(x,b\) coordinates ...function of \(b\) at fixed \(z\). However, the graphical smoothness of the plot at the picture cannot substitute the mathematical proof.14 KB (2,275 words) - 18:25, 30 July 2019
- ...of SuperFactorial causes the only diagnostic message and cannot be used to plot the SuperFactorial.</ref> ...[[complex map]] of SuperFactorial is shown at the figure 2. The [[contour plot]]s of<br>18 KB (2,278 words) - 00:03, 29 February 2024
- ...then combined at the same graphic. The [[C++]] routine for the drawing of contour plots is suggested, namely, [[conto.cin]]. Such a routine seems to be for o2 KB (254 words) - 06:59, 1 December 2018
- // Warning: this set of calls does not close the file. After to plot the [[complex map]], [[Category:Contour plots]]2 KB (392 words) - 14:32, 20 June 2013
- ...iles are huge but the resolution is low. Especially poor are the [[contour plot]]s of singular functions. The standard mathematica routine does not handle12 KB (1,901 words) - 18:43, 30 July 2019
- ArcYulya function is used to make plot of Yulya function, shown at right; while the parameter approaches unity, it The [[contour plot]] of \(f=\mathrm{Yulya}_a(x)\) is shown in the figure at right with lines \12 KB (1,754 words) - 18:25, 30 July 2019
- This implementation above used to plot the [[complex map]] of ArcSin at the top figure. ...e representation can be used for real values of the argument; the explicit plot of ArcSin is generated with the same representation. (Click the figure to s9 KB (982 words) - 18:48, 30 July 2019
- Routine [[conto.cin]] generates the [[contour plot]]s; and in particular, the [[complex map]]s of functions of compex variable4 KB (608 words) - 15:01, 20 June 2013
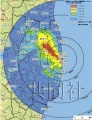
File:47ae1 F59A51E334FB791F36AB413B5BC15C0C.jpg ...rend to the South–West. Up to May 18, no official quantitative [[contour plot]] seem to be available in the network. If someone finds the map, will you b(230 × 300 (25 KB)) - 09:38, 21 June 2013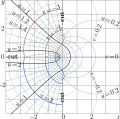
File:AcipmapTjpg.jpg ...d as '''plofu.cin''' . It determines thickness and color of drawing of the contour of levels of constant real part of the function and those for the imaginary The separation from other funcitons allows to plot several maps in the same style. However, for different pictures, the differ(1,759 × 1,746 (661 KB)) - 09:41, 21 June 2013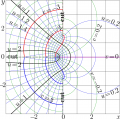
File:AcipmapTpng.png ...d as '''plofu.cin''' . It determines thickness and color of drawing of the contour of levels of constant real part of the function and those for the imaginary The separation from other funcitons allows to plot several maps in the same style. However, for different pictures, the differ(844 × 838 (199 KB)) - 09:41, 21 June 2013
File:ArcCipMapT.jpg ...d as '''plofu.cin''' . It determines thickness and color of drawing of the contour of levels of constant real part of the function and those for the imaginary The separation from other funcitons allows to plot several maps in the same style. However, for different pictures, the differ(1,759 × 1,746 (661 KB)) - 09:41, 21 June 2013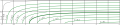
File:ArcYulyaPlot100.png [[Contour plot]] of function inverse of the [[Yulya function]], $\mathrm{ArcYulya}\!=\!\m [[Category:Contour plot]](3,540 × 748 (220 KB)) - 09:39, 21 June 2013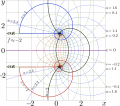
File:B271a.png [[Conto.cin]] , the routine to make the [[contour plot]]. It should be saved as "conto.cin"(1,609 × 1,417 (506 KB)) - 08:30, 1 December 2018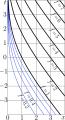
File:DoyaconT70.png [[Contour plot]] of the [[Doya function]] versus argument and parameter. [[Category:Contour plot]](442 × 817 (98 KB)) - 09:39, 21 June 2013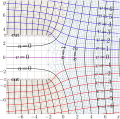
File:TaniaContourPlot100.png // Generator of [[contour plot]] of the [[Tania function]]; drawing of lines in C++(1,182 × 1,168 (931 KB)) - 08:53, 1 December 2018
File:Tetreal2215.gif [[tetre2215.cc]], main program that does the plot<br> [[Category:Contour plots]](876 × 881 (111 KB)) - 09:38, 21 June 2013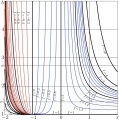
File:Tetreal2215.jpg [[tetre2215.cc]], main program that does the plot<br> // Plot of tetrational $f={\rm te}_{\ln(b)}(z)=tet_b(z) <br>(876 × 881 (130 KB)) - 09:38, 21 June 2013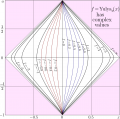
File:Yulya01plot80.png Plot of the [[Yulya function]] [[Category:Contour plots]](1,163 × 1,152 (287 KB)) - 09:39, 21 June 2013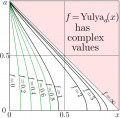
File:Yulyaplot100.png Plot of the [[Yulya function]] [[Category:Contour plots]](762 × 748 (128 KB)) - 09:39, 21 June 2013


