File:2020.03.07fit15t.png

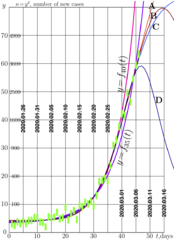
Daily cases of Coronavirus excluding mainland China, data to 2020.03.07 by worldometers [1].
In future, the new green bars are expected to be added to the same figure in order to see, which of the fits drawn is better.
Contents
Description
Let \(n=n(t)\) be number of daily new cases or coronavirus refistered outside of China mainland. This set of data is chosen because the communist ideology of the China administration not only allow misinformation, but proscribe to use it for the propagandistic goals (to show advantages of China and, in general, that of the communistic regime).
Assuming the independent (Poisson) statistics of cases, the statistical deviation of data \(n\) from some trend is supposed to be of order of \(\sqrt{n}\). However, if I plot \(\sqrt{n}\) instead of \(n\), then, the random errors of characterization of spread of the coronavirus is the same for all data; it is of order of unity.
The discrete parameter \(t\) is just number of day since the beginning of alarm and observation. For the analysis, I assume, that 9 cases are registered at the first day of observations, id est, 2020.01.22.
Each datum is represented with green bar; its size corresponds to the typical statistical deviation of the measured number from the general trend. The goal is to choose this trend and use it as forecast, prediction.
The 3-parametric fits happen to be sufficient to be close enough to the experimental bars. The 3 fits are shown with solid line:
\(f_{40}(t) = 3.77461 + 0.097491\, \exp(0.149631 \, t) \phantom{123}\) (rose)
\(f_{35}(t) = 3.23360 + 0.252783\, \exp(0.120411 \, t) \phantom{123}\) (violet)
For 2020.02.07, the two models above may be rejected (refutation) at good level of the statistical significance. (Although the last one fits well the 3 last experimental bars, for days 2020.02.09, 2020.02.10 and 2020.02.11).
This is justification to work with 4-parametric models. the four 4-parametric fits are center with letters A,B,C,D; there four seem to be best among various 4-parameter fits. Thes curves correspond to equations
A: \( y= 107.665 - 51.6531\, \mathrm{erfc}\!\big(0.0693204\,(t\!-\!44.3107)\big) \)
B: \( y= 4.33655+75.3824\, \exp\!\big(-0.00369723\,(t\!-\!54.4402)^2\big) \)
C: \( y= 4.10171+40.5279\,\big(1+\tanh(0.094987\, (t\!-\!41.3478))\big) \)
D: \( y= 3.64316+55.5322/\cosh\!\big(0.148507\, (t\!-\!46.7652)\big) \)
Experimental data
The primary experimental data by worldometers [1] are copipasted below; they refer to year 2020:
1.22 9
1.23 6
1.24 15
1.25 10
1.26 16
1.27 10
1.28 18
1.29 18
1.30 29
1.31 28
2.01 14
2.02 13
2.03 4
2.04 31
2.05 27
2.06 30
2.07 52
2.08 24
2.09 28
2.10 79
2.11 20
2.12 45
2.13 61
2.14 21
2.15 89
2.16 84
2.17 115
2.18 103
2.19 125
2.20 88
2.21 173
2.22 330
2.23 340
2.24 374
2.25 335
2.26 568
2.27 956
2.28 1085
2.29 1416
3.01 1775
3.02 1733
3.03 2454
3.04 2159
3.05 2966
3.06 3526
3.07 4005
C++ generator of curves
#include<math.h>
#include<stdio.h>
#include<stdlib.h>
#define DB double
#define DO(x,y) for(x=0;x<y;x++)
int ado(FILE *O, int X, int Y)
{ fprintf(O,"%c!PS-Adobe-2.0 EPSF-2.0\n",'%');
fprintf(O,"%c%cBoundingBox: 0 0 %d %d\n",'%','%',X,Y);
fprintf(O,"/M {moveto} bind def\n");
fprintf(O,"/L {lineto} bind def\n");
fprintf(O,"/S {stroke} bind def\n");
fprintf(O,"/s {show newpath} bind def\n");
fprintf(O,"/C {closepath} bind def\n");
fprintf(O,"/F {fill} bind def\n");
fprintf(O,"/o {1 0 360 arc C F} bind def\n");
// fprintf(O,"/times-Roman-Bold findfont 20 scalefont setfont\n");
fprintf(O,"/Helvetica-Bold findfont 2 scalefont setfont\n");
fprintf(O,"/W {setlinewidth} bind def\n");
fprintf(O,"/RGB {setrgbcolor} bind def\n");
return 0;
}
double f35(double x){return 3.233596555073794 + 0.25278295790658345*exp(0.1204105367697047*x);}
double f40(double x){return 3.774610005387354 + 0.09749051738788238*exp(0.1496313645313525*x);}
double f41(double x){return 3.415452123434854 + 0.16386947166609223*exp(0.1352858211607943*x);}
DB e61(DB x){ x-=54.4402; x*=x; return 4.33655+75.3824/exp(0.00369723*x);}
DB s61(DB x){ x-=46.7652; return 3.64316+55.5322/cosh(0.148507*x);}
DB fr(DB x) { x-=44.3107; return 107.665-51.6531*erfc(0.0693204*x);}
DB ft(DB x) { x-=41.3478; return 4.10171+40.5279*(1.+tanh(0.094987*x));}
int main(){ DB d,x,y,f,F,G,H; int j,m,n,K,S; FILE *i,*o;
o=fopen("15.eps","w");
ado(o,608,824);
#define M(x,y) fprintf(o,"%6.4f %6.4f M\n",0.+x,0.+y);
#define L(x,y) fprintf(o,"%6.4f %6.4f L\n",0.+x,0.+y);
#define o(x,y) fprintf(o,"%6.2f %6.2f o\n",0.+x,0.+y);
fprintf(o,"2 2 translate 10 10 scale 1 setlinejoin\n");
DO(m,12){M(5*m,0)L(5*m,80)}
DO(n,9){M(0,10*n)L(55,10*n)}
fprintf(o,"0 0 0 RGB 2 setlinecap .1 W S\n");
for(m=0;m<51;m++){y=f40(m); if(m==0)M(m,y) else L(m,y); if(y>81) break ;}fprintf(o,"1 0 .6 RGB 1 setlinecap .3 W S\n");
//for(m=0;m<51;m++){y=f41(m); if(m==0)M(m,y) else L(m,y); if(y>71) break ;}fprintf(o,"0 0 0 RGB 1 setlinecap .3 W S\n");
for(m=0;m<51;m++){y=f35(m); if(m==0)M(m,y) else L(m,y); if(y>81) break ;}fprintf(o,".6 0 1 RGB 1 setlinecap .3 W S\n");
for(m=0;m<61;m++){y=fr(m); if(m==0)M(m,y) else L(m,y); if(y>84) break ;}fprintf(o,"1 .2 0 RGB 1 setlinecap .2 W S\n");
for(m=0;m<61;m++){y=ft(m); if(m==0)M(m,y) else L(m,y); if(y>84) break ;}fprintf(o,"0 .2 1 RGB 1 setlinecap .2 W S\n");
for(m=0;m<61;m++){y=e61(m); if(m==0)M(m,y) else L(m,y); if(y>84) break ;}fprintf(o,".6 0 0 RGB 1 setlinecap .2 W S\n");
for(m=0;m<61;m++){y=s61(m); if(m==0)M(m,y) else L(m,y); if(y>84) break ;}fprintf(o,"0 0 .6 RGB 1 setlinecap .2 W S\n");
fprintf(o,"0 0 0 RGB \n");
i=fopen("daily.txt","r");
S=0;
for(m=1;m<199;m++){j=fscanf(i,"%lf%d",&d,&K); if(j<2) break;
S+=K;
F=f35(m);
G=f40(m);
H=f41(m);
printf("%2d %4.2lf %4d %6d %7.1lf %7.1lf %7.1lf\n",m,d,K,S,F*F,G*G,H*H);
M(m,sqrt(.01+K)-1.)
L(m,sqrt(.01+K)+1.)
if(m/5*5==m) { if(m<40) fprintf(o,"gsave %4.2f 35.5 translate 90 rotate 0 -6 M (2020.0%4.02f) show grestore\n",m-5.3,d);
else fprintf(o,"gsave %4.2f 5.5 translate 90 rotate 0 -6 M (2020.0%4.02f) show grestore\n",m-5.3,d);
}
}
m=50; fprintf(o,"gsave %4.2f 5.5 translate 90 rotate 0 -6 M (2020.03.11) show grestore\n",m-5.3);
m=55; fprintf(o,"gsave %4.2f 5.5 translate 90 rotate 0 -6 M (2020.03.16) show grestore\n",m-5.3);
fclose(i);
fprintf(o,"0 1 0 RGB 1 setlinecap .7 W S\n");
fprintf(o,"showpage\n%c%cTrailer",'%','%'); fclose(o);
system("epstopdf 15.eps");
system( "open 15.pdf");
}
Latex generator of labels
\documentclass[12pt]{article}

\usepackage{geometry}

\usepackage{graphicx}

\usepackage{rotating}

\usepackage{color}

%\definecolor{pink}{RGB}{255,127,255}

\paperwidth 620pt

\paperheight 856pt

\textwidth 800pt

\textheight 1200pt

\topmargin -108pt

\oddsidemargin -72pt

\newcommand \ing {\includegraphics}

\newcommand \sx {\scalebox}

\newcommand \rot {\begin{rotate}}

\newcommand \ero {\end{rotate}}

\pagestyle{empty}

\begin{document}

\parindent 0pt

%\sx{1}[.9]{\begin{picture}(530,830)

{\begin{picture}(530,840)

\put(30,10){\ing{15.pdf}}

%\put(  0,815){\sx{1.7}{$\sqrt{n}$}} \put(60,817){\sx{1.7}{$n$, number of new cases}}

\put(8,815){\sx{2.1}{$y$}} \put(56,820){\sx{1.7}{$n\!=\!y^2$, number of new cases}}

\put(4,707){\sx{2}{70}} \put(33,707){\sx{1.7}{4900}}

\put(4,607){\sx{2}{60}} \put(33,607){\sx{1.7}{3600}}

\put(4,507){\sx{2}{50}} \put(33,507){\sx{1.7}{2500}}

\put(4,407){\sx{2}{40}} \put(33,407){\sx{1.7}{1600}}

\put(4,307){\sx{2}{30}} \put(33,307){\sx{1.7}{~900}}

\put(4,207){\sx{2}{20}} \put(33,207){\sx{1.7}{~400}}

\put(4,107){\sx{2}{10}} \put(33,107){\sx{1.7}{~100}}

\put(4,07){\sx{2}{~0}}

\put(26,-7){\sx{2}{0}}

\put(120,-7){\sx{2}{10}}

\put(221,-7){\sx{2}{20}}

\put(321,-7){\sx{2}{30}}

\put(421,-7){\sx{2}{40}}

\put(521,-7){\sx{2}{50}}

%\put(575,-7){\sx{2}{$t$,days}}

\put(555,-7){\sx{2}{$t$,days}}

\put(434,510){\rot{84}\sx{2.9}{$y\!=\!f_{40}(t)$}\ero}

\put(430,250){\rot{73}\sx{2.9}{$y\!=\!f_{35}(t)$}\ero}

\put(528,810){\sx{2.6}{\bf A}}

\put(534,775){\sx{2.6}{\bf B}}

\put(542,736){\sx{2.6}{\bf C}}

\put(552,474){\sx{2.6}{\bf D}}

\end{picture}}

\end{document}
References
- ↑ 1.0 1.1 https://www.worldometers.info/coronavirus/coronavirus-cases/ Outside of China 2020.03.03
File history
Click on a date/time to view the file as it appeared at that time.
| Date/Time | Thumbnail | Dimensions | User | Comment | |
|---|---|---|---|---|---|
| current | 12:42, 8 March 2020 | | 857 × 1,184 (156 KB) | T (talk | contribs) | update |
| 22:26, 7 March 2020 |  | 857 × 1,184 (156 KB) | T (talk | contribs) |
- You cannot overwrite this file.
File usage
There are no pages that link to this file.