Difference between pages "File:2021.11.28.CovidRussiaDd.png" and "File:2021.11.29.11.51.png"
(Daily death of Covid at Mongolia by Worldometer from 2021.11.29,02:44GMT <ref> https://www.worldometers.info/coronavirus/country/mongolia/ WORLD / COUNTRIES / MONGOLIA Last updated: November 29, 2021, 02:44 GMT Daily New Deaths in Mongolia </re...) |
|||
| Line 1: | Line 1: | ||
| + | == Summary == |
||
| − | + | Daily death of [[Covid]] at Mongolia by [[Worldometer]] from 2021.11.29,02:44GMT |
|
| + | <ref> |
||
| + | https://www.worldometers.info/coronavirus/country/mongolia/ |
||
| + | WORLD / COUNTRIES / MONGOLIA |
||
| + | Last updated: November 29, 2021, 02:44 GMT |
||
| + | Daily New Deaths in Mongolia |
||
| + | </ref>. |
||
| + | There are many publications about [[Covid]] pandemic, |
||
| − | Linear extrapolations of number of daily death cases; |
||
| + | but they do not provide links to tabes the original data about |
||
| − | pessimistic (red) and optimistic (blue). |
||
| + | numbers of cases. This observation indicate, that the most of official publications do not present a scientific concept; |
||
| + | perhaps, the most of publications are just frauds, fakes. |
||
| + | Such a hypothesis explain, why the links to the tables mentioned are usually substituted with pathetic rhetoric; this is observed in many publications with keywords "covid", "covid19", etc. |
||
| + | While the tables of the time series of rate are not available, the saving and analysis of the screenshots of graphics have sense. These screenshots can be used as evidence of the poor qualification, the bad will and/or sabotage of the [[offee]]s who deal with the pandemic. |
||
| − | ==Generator== |
||
| − | Image [[File:2021.11.28.19.13.png|200px]] |
||
| − | should be loaded in order to execute the code below |
||
| − | |||
| − | <pre> |
||
| − | <!DOCTRINE html><html><body><small><small> |
||
| − | <svg width="800" height="400"> |
||
| − | <image x="0" y="0" width="716" height="400" xlink:href="2021.11.28.19.13.png"/> |
||
| − | <?php |
||
| − | $z=60; |
||
| − | $j0=juliantojd(2, 15, 2020); |
||
| − | $d0=jdtojulian($j0); |
||
| − | for($x0=0;$x0<800;$x0+=26) |
||
| − | {$x=$x0+$z; |
||
| − | $xp=$x+4; |
||
| − | $j=$j0+$x0; |
||
| − | $d0=jdtojulian($j); |
||
| − | //$d1=split("/",$d0); |
||
| − | $d1=explode("/",$d0); |
||
| − | $text=sprintf("%04d.%02d.%02d",$d1[2],$d1[0],$d1[1]); |
||
| − | echo "<line x1=$x y1=30 x2=$x y2=400 stroke='RGB(255,0,255)' stroke-width='1.2' />\n"; |
||
| − | echo "<text transform='translate($xp,200) rotate(-90)'>$text</text> \n"; |
||
| − | echo "<text transform='translate($xp,400) rotate(-90)'>$x0</text> \n"; |
||
| − | } |
||
| − | |||
| − | $y1=300; |
||
| − | $z2=$z+800; |
||
| − | $y2=$y1 - .35*800; |
||
| − | echo "<line x1=$z y1=$y1 x2=$z2 y2=$y2 stroke='RGB(255,0,0)' stroke-width='1' />\n"; |
||
| − | |||
| − | $y1=310; |
||
| − | $z2=$z+800; |
||
| − | $y2=$y1 - .164*800; |
||
| − | echo "<line x1=$z y1=$y1 x2=$z2 y2=$y2 stroke='RGB(0,0,255)' stroke-width='1' />\n"; |
||
| − | ?> |
||
| − | </svg> |
||
| − | </body> |
||
| − | </html> |
||
| − | </pre> |
||
| + | Similar attempts to hide information about the danger take place in the case of nuclear disaster; the sabotage of the dozimetrists is observed as delay (years in case of the [[Chernobyl disaster]], weeks in the case of the [[Fukushima disaster]]) with publication of maps of density of ionizing radiation. |
||
==References== |
==References== |
||
<references/> |
<references/> |
||
| − | https://www.worldometers.info/coronavirus/country/russia/ |
||
| − | Last updated: November 28, 2021, 09:51 GMT |
||
| − | [[Category:Collapse of RF]] |
||
[[Category:Covid]] |
[[Category:Covid]] |
||
[[Category:History]] |
[[Category:History]] |
||
| − | [[Category: |
+ | [[Category:Mongolia]] |
| − | [[Category: |
+ | [[Category:Screenshot]] |
| − | [[Category: |
+ | [[Category:Worldometer]] |
| − | [[Category:SVG]] |
||
| − | [[Category:Wolrdometer]] |
||
Latest revision as of 14:03, 29 November 2021
Summary
Daily death of Covid at Mongolia by Worldometer from 2021.11.29,02:44GMT [1].
There are many publications about Covid pandemic, but they do not provide links to tabes the original data about numbers of cases. This observation indicate, that the most of official publications do not present a scientific concept; perhaps, the most of publications are just frauds, fakes. Such a hypothesis explain, why the links to the tables mentioned are usually substituted with pathetic rhetoric; this is observed in many publications with keywords "covid", "covid19", etc.
While the tables of the time series of rate are not available, the saving and analysis of the screenshots of graphics have sense. These screenshots can be used as evidence of the poor qualification, the bad will and/or sabotage of the offees who deal with the pandemic.
Similar attempts to hide information about the danger take place in the case of nuclear disaster; the sabotage of the dozimetrists is observed as delay (years in case of the Chernobyl disaster, weeks in the case of the Fukushima disaster) with publication of maps of density of ionizing radiation.
References
- ↑ https://www.worldometers.info/coronavirus/country/mongolia/ WORLD / COUNTRIES / MONGOLIA Last updated: November 29, 2021, 02:44 GMT Daily New Deaths in Mongolia
File history
Click on a date/time to view the file as it appeared at that time.
| Date/Time | Thumbnail | Dimensions | User | Comment | |
|---|---|---|---|---|---|
| current | 20:52, 28 November 2021 | 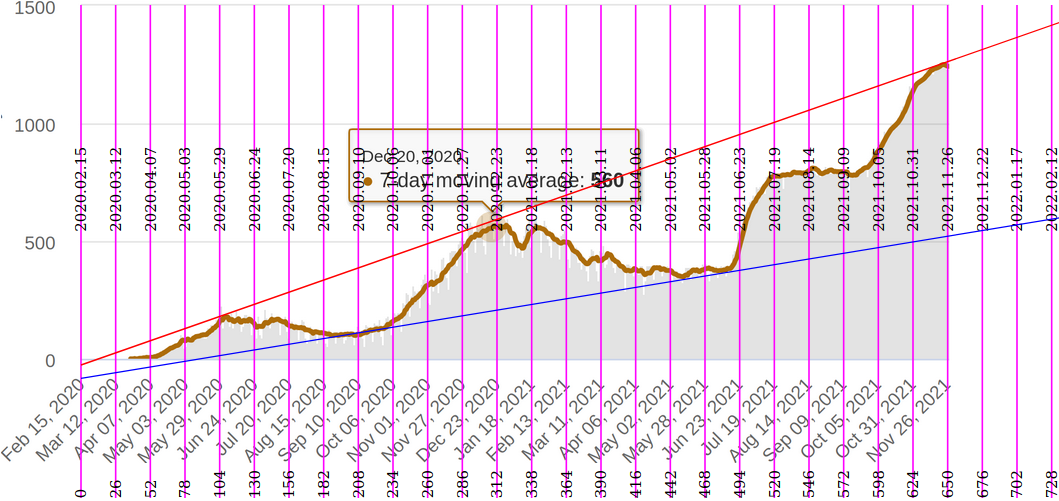 | 1,059 × 501 (207 KB) | T (talk | contribs) |
- You cannot overwrite this file.
File usage
The following page links to this file: