File:WarmingNasa2024Wars.png
Contents
Summary
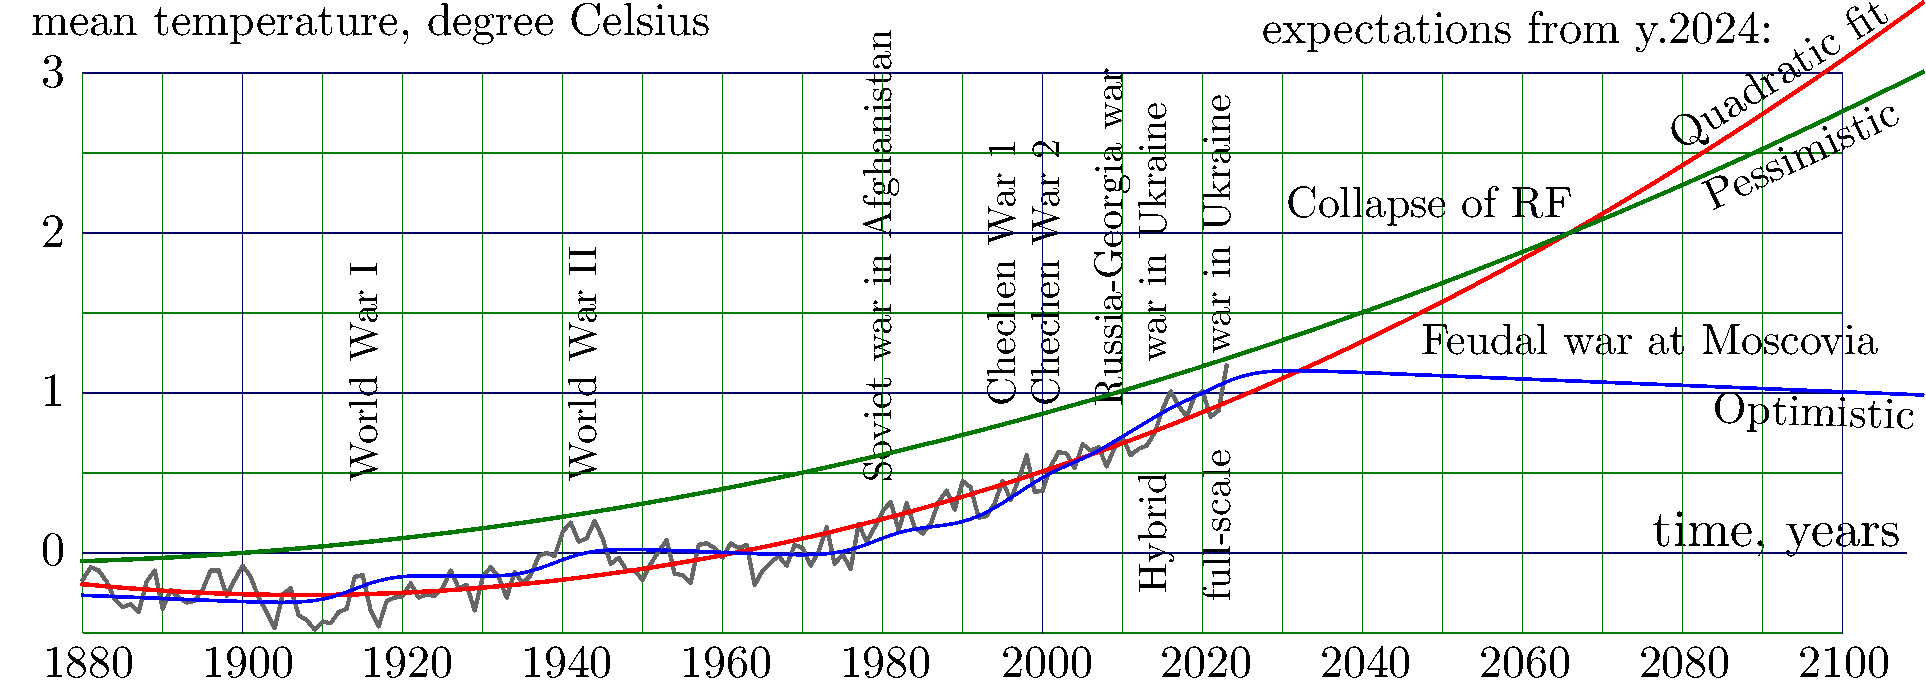
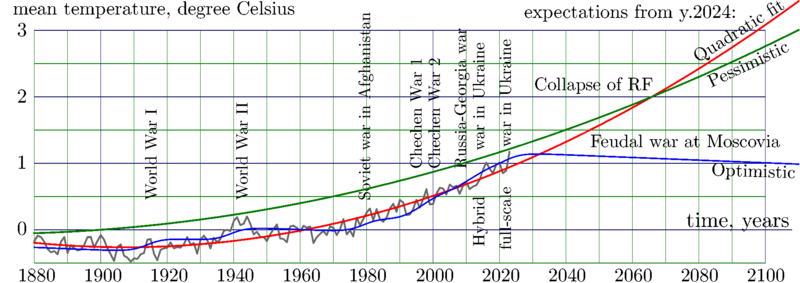
Data by Nasa about the year «mean temperature» [1], black curve, and the speculations around.
The picture is an attempt to interpret the evidence of the Global warming as a result of human activity.
Description
The abscissa is time y measured in years.
The ordinate is «mean temperature» z in the Celsius scale.
Black curve shows the data by NASA.
Red curve shows the quadratic fit:
z= 0.50957748 + t*(0.01669969 + t*0.00009021 )
where t=y-2000
The sum of squares of deviations for this approximation is 2.01 (Celsius2)
Green curve shows the pessimistic estimate; it is parabola that lies above all the values available:
z= 0.87 + t*(0.0138 + t*0.000051 )
The blue curve represents the primitive model, in which the warming is interpreted as a result of big wars that may cause covering of snow with ache and aged the main temperature:
z= -.265 - .002*(y-1880)
+ .107*(1.+tanh(.2*(y-1914.)))
+ .107*(1.+tanh(.2*(y-1939.)))
+ .107*(1.+tanh(.2*(y-1979.)))
+ .107*(1.+tanh(.2*(y-1994.)))
+ .107*(1.+tanh(.2*(y-1999.)))
+ .107*(1.+tanh(.2*(y-2008.)))
+ .107*(1.+tanh(.2*(y-2014.)))
+ .107*(1.+tanh(.2*(y-2022.)))
The following wars are taken into account:
World War I, 1914
World War II, 1939
Soviet invasion into Afghanistan, 1979
First Chechen war, 1994
Second Chechen war, 1999
Russian invasion into Georgia, 2008
Annexation of Crimea and seizing of Ordlo (Hybrid war), 2014
Full-scale Russia-Ukraine war (spetsoperation), 2022
In the primitive model, the contributions of these wars are assumed to be similar.
The sum of squares of deviations for this approximation is 1.73 (Celsius2);
it is 14% better than that the quadratic approximation.
The blue curve corresponds to hypothesis that the Putin world war stops approximately in year 2025; then without big wars, the mean temperature decreases.
In such a way, the model with blue curve is not so realistic.
Original data
1880     -0.17     -0.10
1881     -0.09     -0.13
1882     -0.11     -0.17
1883     -0.18     -0.21
1884     -0.29     -0.24
1885     -0.34     -0.27
1886     -0.32     -0.28
1887     -0.37     -0.28
1888     -0.18     -0.27
1889     -0.11     -0.26
1890     -0.35     -0.26
1891     -0.23     -0.26
1892     -0.28     -0.27
1893     -0.31     -0.26
1894     -0.30     -0.24
1895     -0.23     -0.22
1896     -0.11     -0.20
1897     -0.11     -0.18
1898     -0.27     -0.17
1899     -0.17     -0.17
1900     -0.08     -0.20
1901     -0.15     -0.23
1902     -0.28     -0.26
1903     -0.37     -0.28
1904     -0.47     -0.31
1905     -0.26     -0.34
1906     -0.22     -0.36
1907     -0.39     -0.37
1908     -0.42     -0.39
1909     -0.48     -0.41
1910     -0.43     -0.41
1911     -0.44     -0.39
1912     -0.37     -0.35
1913     -0.35     -0.33
1914     -0.15     -0.31
1915     -0.14     -0.31
1916     -0.36     -0.30
1917     -0.46     -0.30
1918     -0.30     -0.30
1919     -0.28     -0.29
1920     -0.27     -0.28
1921     -0.19     -0.26
1922     -0.28     -0.25
1923     -0.26     -0.24
1924     -0.27     -0.23
1925     -0.22     -0.22
1926     -0.11     -0.22
1927     -0.22     -0.21
1928     -0.20     -0.20
1929     -0.36     -0.19
1930     -0.15     -0.19
1931     -0.09     -0.18
1932     -0.15     -0.17
1933     -0.28     -0.16
1934     -0.12     -0.15
1935     -0.19     -0.13
1936     -0.14     -0.10
1937     -0.02     -0.06
1938      0.00     -0.01
1939     -0.02      0.03
1940      0.13      0.07
1941      0.19      0.09
1942      0.07      0.11
1943      0.09      0.10
1944      0.20      0.07
1945      0.09      0.04
1946     -0.07      0.00
1947     -0.03     -0.04
1948     -0.11     -0.07
1949     -0.11     -0.08
1950     -0.17     -0.08
1951     -0.07     -0.07
1952      0.01     -0.07
1953      0.08     -0.07
1954     -0.13     -0.06
1955     -0.14     -0.06
1956     -0.19     -0.05
1957      0.05     -0.04
1958      0.06     -0.01
1959      0.03      0.01
1960     -0.03      0.03
1961      0.06      0.01
1962      0.03     -0.01
1963      0.05     -0.03
1964     -0.20     -0.04
1965     -0.11     -0.05
1966     -0.06     -0.06
1967     -0.02     -0.05
1968     -0.08     -0.03
1969      0.05     -0.02
1970      0.03     -0.00
1971     -0.08      0.00
1972      0.01      0.00
1973      0.16     -0.00
1974     -0.07      0.01
1975     -0.01      0.02
1976     -0.10      0.04
1977      0.18      0.07
1978      0.07      0.12
1979      0.16      0.16
1980      0.26      0.20
1981      0.32      0.21
1982      0.14      0.22
1983      0.31      0.21
1984      0.16      0.21
1985      0.12      0.22
1986      0.18      0.24
1987      0.32      0.27
1988      0.39      0.31
1989      0.27      0.33
1990      0.45      0.33
1991      0.41      0.33
1992      0.22      0.33
1993      0.23      0.33
1994      0.31      0.34
1995      0.45      0.37
1996      0.33      0.40
1997      0.46      0.42
1998      0.61      0.44
1999      0.38      0.47
2000      0.39      0.50
2001      0.54      0.52
2002      0.63      0.55
2003      0.62      0.58
2004      0.53      0.61
2005      0.68      0.62
2006      0.64      0.62
2007      0.66      0.63
2008      0.54      0.64
2009      0.66      0.64
2010      0.72      0.65
2011      0.61      0.66
2012      0.65      0.70
2013      0.67      0.74
2014      0.75      0.78
2015      0.90      0.83
2016      1.01      0.87
2017      0.92      0.91
2018      0.85      0.93
2019      0.98      0.93
2020      1.01      0.95
2021      0.85      0.97
2022      0.89      0.99
2023      1.17      1.01
C++ generator of curves
//File ado.cin should be saved in the parent directory in order to compile the code below.
//In order to execute the generator, the data of the previous section should be saved as ../01.txt
#include <math.h>
#include <stdio.h>
#include <stdlib.h>
#include "../ado.cin"

#define DB double

DB f32(int y){ DB t=y-2000.; return 0.50957748 + t*(0.01669969 + t*0.00009021 );}
DB g32(int y){ DB t=y-2000.; return 0.87       + t*(0.0138       + t*0.000051 );}

DB gw2(int y){
DB z = -.265;
z -= .002*(y-1880);
z += .107*(1.+tanh(.2*(y-1914.)));
z += .107*(1.+tanh(.2*(y-1939.)));
z += .107*(1.+tanh(.2*(y-1979.)));
z += .107*(1.+tanh(.2*(y-1994.)));
z += .107*(1.+tanh(.2*(y-1999.)));
z += .107*(1.+tanh(.2*(y-2008.)));
z += .107*(1.+tanh(.2*(y-2014.)));
z += .107*(1.+tanh(.2*(y-2022.)));
return z;
}

int main(){ FILE *o; int M,m,N,n,r,Y,y; float g,h,a[2100],z,s,c,d;
o=fopen("../01.txt","r");

for(m=0;m<240;m++)
{
r=fscanf(o,"%d%f%f",&y,&g,&h); if(r<3) break;
a[y]=g; //printf("%4d %5.2f %5.2f %5.2f\n",y,g,a[y],h);
}
fclose (o);

o=fopen("53.eps","w");
ado(o,1000,400);
#define M(x,y) fprintf(o,"%6.2f %8.2f M\n",0.+x,0.+y);
#define L(x,y) fprintf(o,"%6.2f %8.2f L\n",0.+x,0.+y);
#define S() fprintf(o,"S\n");

fprintf(o,"4 4 scale -1870 20 translate 2 setlinecap 1 setlinejoin\n");

M(1880, -10) L(1880,60)
M(1890, -10) L(1890,60)

M(1910, -10) L(1910,60)
M(1920, -10) L(1920,60)
M(1930, -10) L(1930,60)
M(1940, -10) L(1940,60)
M(1950, -10) L(1950,60)
M(1960, -10) L(1960,60)
M(1970, -10) L(1970,60)
M(1980, -10) L(1980,60)
M(1990, -10) L(1990,60)
M(2010, -10) L(2010,60)

M(2020, -10) L(2020,60)
M(2030, -10) L(2030,60)
M(2040, -10) L(2040,60)
M(2050, -10) L(2050,60)
M(2060, -10) L(2060,60)
M(2070, -10) L(2070,60)
M(2080, -10) L(2080,60)
M(2090, -10) L(2090,60)

M(1880, 50) L(2100,50)
M(1880, 30) L(2100,30)
M(1880, 10) L(2100,10)
M(1880,-10) L(2100,-10)

fprintf(o,"0.09 setlinewidth 0 .5 0 RGB S\n");

M(1900, -10) L(1900,60)
M(2000, -10) L(2000,60)
M(2100, -10) L(2100,60)

M(1880, 60) L(2100,60)
M(1880, 40) L(2100,40)
M(1880, 20) L(2100,20)
M(1880, 0) L(2108,0)
//M(1880, -20) L(2050,-20)

fprintf(o,"0.12 setlinewidth 0 0 .4 RGB S\n");

                    M(1880,20*a[1880]);
for(y=1881;y<2024;y++) L(y,20*a[y])
fprintf(o,"0.5 setlinewidth .4 .4 .4 RGB S\n");

                    M(1880,20*f32(1880));
for(y=1881;y<2111;y++) L(y,20*f32(y))
fprintf(o,"0.5 setlinewidth 1 0 0 RGB S\n");

                    M(1880,20*g32(1880));
for(y=1881;y<2111;y++) L(y,20*g32(y))
fprintf(o,".5 setlinewidth 0 .5 0 RGB S\n");

                    M(1880,20*gw2(1880));
for(y=1881;y<2111;y++) L(y,20*gw2(y))
fprintf(o,"0.4 setlinewidth 0 0 1 RGB S\n");

fprintf(o,"showpage\n%c%cTrailer",'%','%'); fclose(o);
     system("epstopdf 53.eps");
     system("open 53.pdf");
s=0; c=0;

for(y=1880;y<2024;y++)
{
d=f32(y)-a[y]; s+=d*d;
d=gw2(y)-a[y]; c+=d*d;
//printf("%4d %8.4f %8.4f %8.4f %8.6f %8.6f\n",y,a[y],g32(y),gw2(y), s,c);
}
printf("%8.6f %8.6f\n",s,c);
}
Latex generator of labels
%File 53.eps shouts be generated with code above in order to latex the document below.
\documentclass{standalone}
\usepackage{graphicx}
\usepackage{rotating}
\newcommand \sx {\scalebox}
\newcommand \rot {\begin{rotate}}
\newcommand \ero {\end{rotate}}
\begin{document}
%\scalebox{2}[3]
\scalebox{2}
{
\begin{picture}(960,342)
%\put(-18,6){\scalebox{0.3793}[0.135]{\includegraphics{../NasaGlobalTemperature2024big.png}}}
\put(12,324){\sx{2.3}{mean temperature, degree Celsius}}
\put(630,320){\sx{2.3}{expectations from y.2024:}}
\put(17,298){\sx{2.4}{$3$}}
%\put(7,258){\sx{2.2}{$2.5$}}
\put(17,218){\sx{2.4}{$2$}}
%\put(7,178){\sx{2.2}{$1.5$}}
\put(17,138){\sx{2.4}{$1$}}
%\put(7,98){\sx{2.2}{$0.5$}}
\put(826,68){\sx{2.6}{time, years}}
\put(17,58){\sx{2.4}{$0$}}
%\put(-6, 19){\sx{2.2}{$-0.5$}}
\put(18,  2){\sx{2.3}{$1880$}}
\put(98,  2){\sx{2.3}{$1900$}}
\put(186, 100){\sx{2}{\rot{90}World War I\ero }}
\put(178,  2){\sx{2.3}{$1920$}}
\put(258,  2){\sx{2.3}{$1940$}}
\put(296, 100){\sx{2}{\rot{90}World War II\ero }}
%\put(300,  2){\sx{1.9}{$1950$}}
\put(338,  2){\sx{2.3}{$1960$}}
\put(444, 100){\sx{2}{\rot{90}Soviet war in Afghanistan\ero }}
\put(418,  2){\sx{2.3}{$1980$}}
\put(506, 138){\sx{2}{\rot{90}Chechen War 1\ero }}
\put(528, 138){\sx{2}{\rot{90}Chechen War 2\ero }}
\put(560, 138){\sx{2}{\rot{90}Russia-Georgia war\ero }}
\put(582,  44){\sx{2}{\rot{90}Hybrid\ero }}
\put(582, 160){\sx{2}{\rot{90}war in Ukraine\ero }}
\put(614,  40){\sx{2}{\rot{90}full-scale\ero }}
\put(614, 164){\sx{2}{\rot{90}war in Ukraine\ero }}
\put(499,  2){\sx{2.3}{$2000$}}
\put(579,  2){\sx{2.3}{$2020$}}
\put(659,  2){\sx{2.3}{$2040$}}
\put(739,  2){\sx{2.3}{$2060$}}
\put(819,  2){\sx{2.3}{$2080$}}
\put(899,  2){\sx{2.3}{$2100$}}
\put(-2,-16){\includegraphics{53.eps}}
\put(840, 266){\sx{2.2}{\rot{32}Quadratic fit\ero }}
\put(856, 236){\sx{2.2}{\rot{25}Pessimistic\ero }}
\put(856, 130){\sx{2.2}{\rot{-2}Optimistic\ero }}
\put(642, 233){\sx{2.2}{Collapse of RF}}
%\put(780, 190){\sx{2.2}{Collapse of RF}}
\put(710, 164){\sx{2.2}{Feudal war at Moscovia}}

\end{picture}
}
Description
Warning
References
- ↑ https://data.giss.nasa.gov/gistemp/graphs/graph_data/Global_Mean_Estimates_based_on_Land_and_Ocean_Data/graph.txt Land-Ocean Temperature Index (C) (2024) - - Year No_Smoothing Lowess(5)
Keywords
«[[]]», «Global warming», «NASA», «Russian invasion into Georiga», «Russian invasion into Ukraine», «[[]]»,
«Агрессор и оккупант», «Вторая мировая война», «Глобальное потепление», «Первая Мировая война», «Путинская мировая война», «[[]]», «Российское вторжение в Грузию», «Российкое вторжение в Украину», «Русский мир», «Советское вторжение в Агфанистан», «Спецоперация», «Чеченские войны», «[[]]»,
File history
Click on a date/time to view the file as it appeared at that time.
| Date/Time | Thumbnail | Dimensions | User | Comment | |
|---|---|---|---|---|---|
| current | 18:45, 6 August 2024 | 1,926 × 681 (43 KB) | T (talk | contribs) | == Summary == {{oq|WarmingNasa2024Wars.png|1926x681+0+0}} Data by Nasa about the year «mean temperature» <ref> https://data.giss.nasa.gov/gistemp/graphs/graph_data/Global_Mean_Estimates_based_on_Land_and_Ocean_Data/graph.txt Land-Ocean Temperature I... |
- You cannot overwrite this file.
File usage
There are no pages that link to this file.